

![Best Fidelity ETFs [2025] | Top 24 Funds Ranked by Assets Under Management](https://bullishflow.com/wp-content/uploads/2025/11/Fidelity-Investiments-ETFs-1024x576.png)
Fidelity ETFs combine low-cost index investing with active management expertise, offering investors diverse portfolio building blocks across stocks, bonds, and alternative assets.
Founded in 1946, Fidelity Investments has grown into one of the world’s largest asset managers with over $4 trillion in assets.
Fidelity’s ETF lineup includes both passive index funds and actively managed strategies designed to outperform benchmarks.
This comprehensive guide analyzes the 24 best Fidelity ETFs ranked by assets under management, providing detailed analysis of expense ratios, dividend yields, holdings, and investment strategies.
Key Takeaways
- Fidelity offers 24+ ETFs spanning U.S. stocks, international equities, bonds, sectors, and factor strategies with assets ranging from $1.2 billion to over $22 billion per fund
- Ultra-low expense ratios with many funds charging just 0.08-0.18%, making Fidelity competitive with Vanguard and other low-cost leaders
- Mix of passive and active strategies including traditional index funds and enhanced/factor-based approaches designed to outperform
- Strong dividend focus with multiple high-dividend and dividend growth ETFs yielding 1.5-4.5% for income-focused investors
- Cryptocurrency exposure through Bitcoin (FBTC) and Ethereum (FETH) funds, offering regulated access to digital assets
- Factor investing options including low volatility, quality, momentum, and multifactor strategies for sophisticated portfolio construction
- Sector coverage across technology, healthcare, financials, utilities, communications, consumer sectors, and industrials
- Tax efficiency through ETF structure minimizing capital gains distributions compared to mutual funds
- No account minimums beyond one share price, making Fidelity ETFs accessible for investors starting with small amounts
Understanding ETF Investing: Essential Definitions
Before diving into specific Fidelity ETFs, understanding key investment concepts helps investors make informed portfolio decisions.
What is an ETF?
An ETF (Exchange-Traded Fund) is an investment vehicle that trades on stock exchanges like individual stocks while holding a diversified basket of securities.
ETFs can hold stocks, bonds, commodities, real estate, or other assets, providing instant diversification through a single investment. Unlike mutual funds that price once daily, ETFs trade continuously throughout market hours at market-determined prices.
This structure combines mutual fund diversification with stock-like trading flexibility and superior tax efficiency. Investors buy and sell ETF shares through any brokerage account during market hours.
What is an Expense Ratio?
The expense ratio represents the annual fee an ETF charges, expressed as a percentage of assets invested.
For example, a 0.08% expense ratio means you pay $8 annually per $10,000 invested. This fee covers portfolio management, administrative costs, marketing, and operational expenses.
Fidelity’s expense ratios range from 0.08% to 0.59%, with most equity ETFs charging 0.08-0.28%. Over decades, low expense ratios compound significantly compared to higher-fee alternatives charging 0.50% or more.
What is a Dividend?
A dividend is a cash payment made by a company to shareholders, typically distributed from profits or retained earnings.
Companies pay dividends as rewards for investing, usually quarterly, providing income beyond potential stock price appreciation. Dividend-paying stocks offer regular cash flows that can be reinvested or used as income.
ETFs collect dividends from underlying holdings and distribute them to ETF shareholders on quarterly or monthly schedules.
Distribution amounts and frequency depend on the dividend policies of companies held within each fund.
What is Dividend Yield?
Dividend yield measures annual dividend income as a percentage of the current ETF price.
For example, an ETF trading at $100 with $3 annual dividends has a 3.00% yield.
Dividend yield fluctuates as ETF prices change, even if dividend payments remain constant.
Higher yields provide more income relative to investment amount, though ultra-high yields may signal sustainability concerns.
Fidelity’s dividend-focused ETFs typically yield between 1.5% and 4.5%.
What is a Factor Investment?
Factor investing targets specific characteristics or “factors” that historically drive superior risk-adjusted returns.
Common factors include value (low valuation multiples), momentum (recent price strength), quality (strong profitability), size (market capitalization), and low volatility (price stability).
Factor-based ETFs systematically overweight stocks exhibiting desired characteristics.
Fidelity offers several factor ETFs including enhanced, multifactor, and low volatility strategies. These funds aim to outperform market-cap-weighted indexes through systematic factor exposure.
What is Active Management vs. Passive Indexing?
Active management involves portfolio managers making investment decisions to outperform benchmarks through security selection and timing.
Passive indexing simply replicates a market index, holding all securities in the same proportions as the benchmark.
Active funds charge higher fees but aim for better performance, while passive funds minimize costs and match index returns.
Fidelity’s ETF lineup includes both passive index funds (MSCI-based) and enhanced/factor strategies that add active elements while maintaining relatively low costs.
Complete Fidelity ETFs Ranked by Assets
Below is the complete ranking of 24 Fidelity ETFs by assets under management, showing the most popular and widely-held funds.
| Symbol | Fund Name | Assets (B) | Div. Yield | Exp. Ratio |
| FBND | Fidelity Total Bond ETF | $22.8B | 4.56% | 0.36% |
| FBTC | Fidelity Wise Origin Bitcoin Fund | $17.0B | 0.25% | |
| FTEC | Fidelity MSCI Information Technology Index ETF | $15.9B | 0.41% | 0.08% |
| ONEQ | Fidelity Nasdaq Composite Index ETF | $8.8B | 0.57% | 0.21% |
| FDVV | Fidelity High Dividend ETF | $7.3B | 3.09% | 0.16% |
| FELC | Fidelity Enhanced Large Cap Core ETF | $5.5B | 0.96% | 0.18% |
| FENI | Fidelity Enhanced International ETF | $5.0B | 2.56% | 0.28% |
| FBCG | Fidelity Blue Chip Growth ETF | $4.9B | 0.11% | 0.59% |
| FELG | Fidelity Enhanced Large Cap Growth ETF | $4.4B | 0.40% | 0.18% |
| FSEC | Fidelity Investment Grade Securitized ETF | $4.3B | 3.54% | 0.36% |
| FMDE | Fidelity Enhanced Mid Cap ETF | $4.1B | 1.25% | 0.23% |
| FESM | Fidelity Enhanced Small Cap ETF | $2.8B | 1.07% | 0.28% |
| FHLC | Fidelity MSCI Health Care Index ETF | $2.8B | 1.36% | 0.08% |
| FELV | Fidelity Enhanced Large Cap Value ETF | $2.4B | 1.74% | 0.18% |
| FNCL | Fidelity MSCI Financials Index ETF | $2.3B | 1.53% | 0.08% |
| FUTY | Fidelity MSCI Utilities Index ETF | $2.2B | 2.56% | 0.08% |
| FETH | Fidelity Ethereum Fund ETF | $1.9B | N/A | 0.25% |
| FCOM | Fidelity MSCI Communication Services Index ETF | $1.8B | 0.89% | 0.08% |
| FDIS | Fidelity MSCI Consumer Discretionary Index ETF | $1.8B | 0.89% | 0.08% |
| FSMD | Fidelity Small-Mid Multifactor ETF | $1.8B | 0.77% | 0.16% |
| FDLO | Fidelity Low Volatility Factor ETF | $1.4B | 1.39% | 0.16% |
| FIDU | Fidelity MSCI Industrial Index ETF | $1.4B | 1.37% | 0.08% |
| FSTA | Fidelity MSCI Consumer Staples Index ETF | $1.3B | 2.29% | 0.08% |
Note: Assets under management and yields are current as of November 2025 and subject to change.
Best Fidelity ETFs: Detailed Analysis
Below you’ll find comprehensive analysis of the 24 best Fidelity ETFs ranked by assets under management.
Best Fidelity ETF #1: Fidelity Total Bond ETF (FBND)
Assets Under Management: $22.8 billion
Dividend Yield: 4.56%
Expense Ratio: 0.36%
Number of Holdings: 2,800+
The Fidelity Total Bond ETF is Fidelity’s largest fund, providing comprehensive exposure to the U.S. investment-grade bond market.
FBND offers broad fixed income diversification across government bonds, corporate bonds, mortgage-backed securities, and asset-backed securities. The fund targets intermediate-term bonds with an average duration of approximately 6-7 years.
With nearly $23 billion in assets and a 4.56% dividend yield, FBND serves as a core bond holding for income-focused investors. The fund provides portfolio stability and monthly income distributions.
The 0.36% expense ratio is higher than ultra-low-cost bond index funds but remains competitive for actively managed fixed income exposure. FBND offers professional bond management with Fidelity’s fixed income expertise.
Note: Bond ETF holdings consist primarily of individual bonds rather than stocks, so individual holdings are not listed.
Best Fidelity ETF #2: Fidelity Wise Origin Bitcoin Fund (FBTC)
Assets Under Management: $17.0 billion
Dividend Yield: None
Expense Ratio: 0.25%
Number of Holdings: Bitcoin only
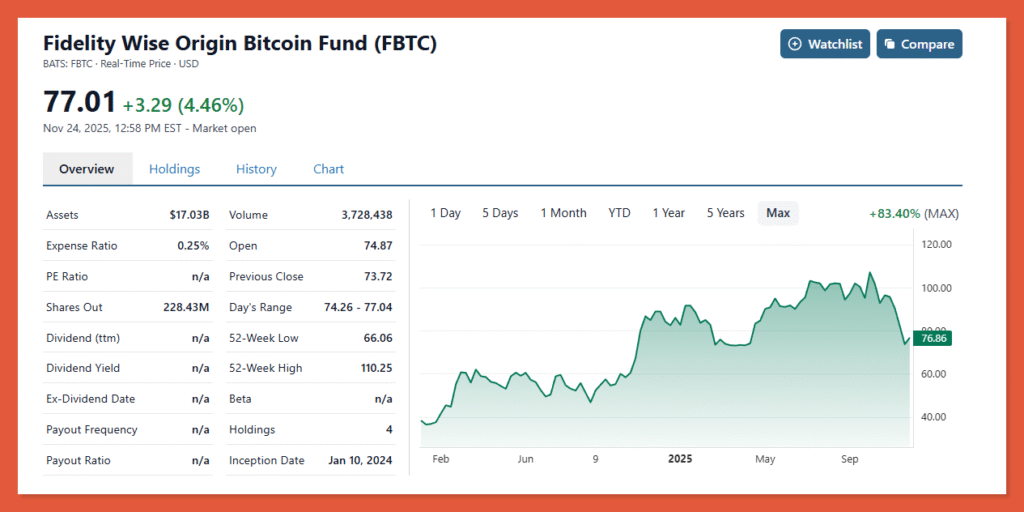
The Fidelity Wise Origin Bitcoin Fund provides direct exposure to Bitcoin through a regulated ETF structure.
FBTC holds actual Bitcoin, offering investors access to cryptocurrency through traditional brokerage accounts without needing digital wallets or cryptocurrency exchanges. The fund tracks Bitcoin’s spot price with minimal tracking error.
Launched in 2024, FBTC has quickly accumulated $17 billion in assets as investors seek cryptocurrency exposure. The fund eliminates custody concerns and simplifies Bitcoin investing for traditional investors.
The 0.25% expense ratio is competitive among Bitcoin ETFs and significantly lower than many cryptocurrency investment vehicles. FBTC provides Bitcoin exposure with institutional-grade security and regulatory compliance.
Holdings: 100% Bitcoin (BTC)
Best Fidelity ETF #3: Fidelity MSCI Information Technology Index ETF (FTEC)
Assets Under Management: $15.9 billion
Dividend Yield: 0.41%
Expense Ratio: 0.08%
Number of Holdings: 330+
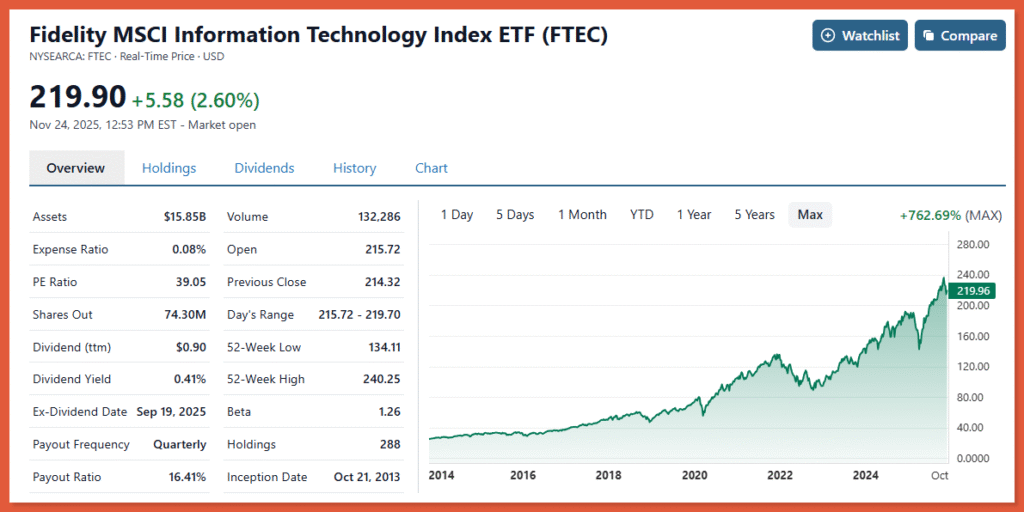
The Fidelity MSCI Information Technology Index ETF provides concentrated exposure to the technology sector.
FTEC tracks the MSCI USA IMI Information Technology Index, holding approximately 330 technology stocks including software, hardware, semiconductors, and IT services companies. The fund captures the entire U.S. technology sector across all market capitalizations.
Technology remains one of the fastest-growing sectors with secular tailwinds from artificial intelligence, cloud computing, cybersecurity, and digital transformation. FTEC provides pure-play technology exposure at minimal cost.
With nearly $16 billion in assets and a rock-bottom 0.08% expense ratio, FTEC is Fidelity’s third-largest ETF and most popular sector fund. The low 0.41% dividend yield reflects technology companies’ focus on growth over income.
Top 10 Holdings:
- NVIDIA Corporation (NVDA) – 17.7%
- Apple Inc. (AAPL) – 14.67%
- Microsoft Corporation (MSFT) – 12.95%
- Broadcom Inc (AVGO) – 4.28%
- Advanced Micro Devices, Inc. (AMD) – 1.95%
- Palantir Technologies Inc. (PLTR) – 1.90%
- Oracle Corporation (ORCL) – 1.84%
- Cisco Systems, Inc. (CSCO) – 1.58%
- International Business Machines Corporation (IBM) – 1.40%
- Micron Technology, Inc. (MU) – 1.40%
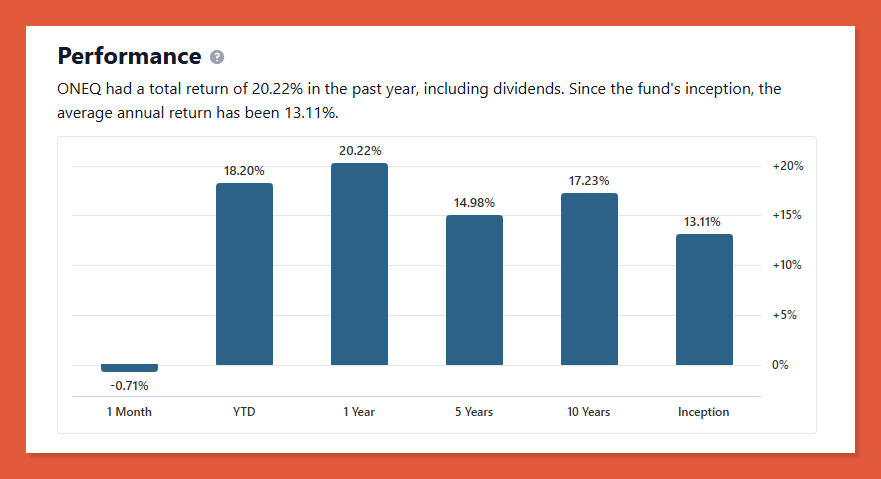
Best Fidelity ETF #4: Fidelity Nasdaq Composite Index ETF (ONEQ)
Assets Under Management: $8.8 billion
Dividend Yield: 0.57%
Expense Ratio: 0.21%
Number of Holdings: 2,500+
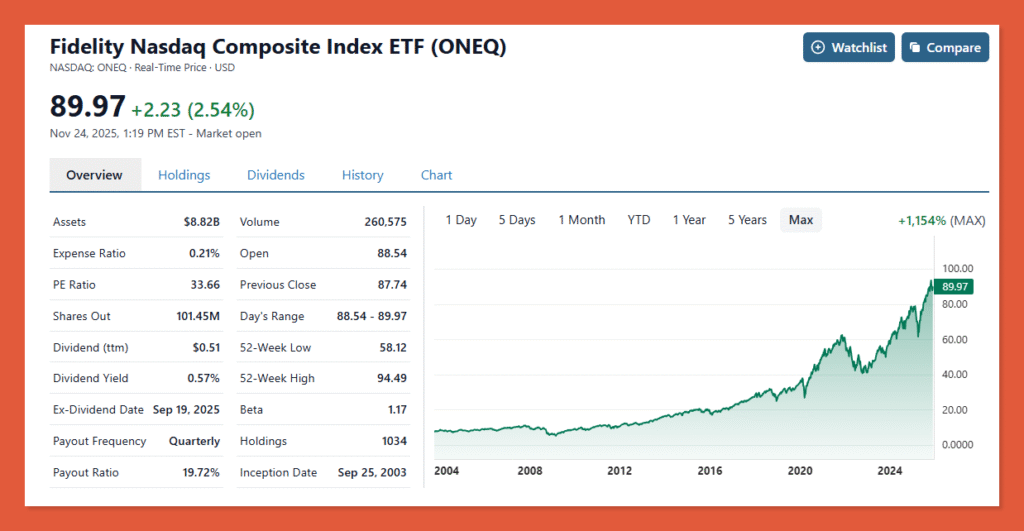
The Fidelity Nasdaq Composite Index ETF tracks the entire Nasdaq Composite Index including growth and technology stocks.
ONEQ holds approximately 2,500 stocks listed on the Nasdaq exchange, providing comprehensive coverage of this growth-oriented market. The fund captures technology, biotechnology, and innovative companies that characterize the Nasdaq.
The Nasdaq Composite has historically outperformed broader market indexes during growth-led bull markets. ONEQ offers concentrated exposure to this innovation-focused exchange.
With $8.8 billion in assets and a 0.21% expense ratio, ONEQ provides cost-effective Nasdaq exposure. The 0.57% dividend yield is low, reflecting the growth orientation of Nasdaq-listed companies.
Top 10 Holdings:
- NVIDIA Corporation (NVDA) – 12.13%
- Apple Inc. (AAPL) –10.92%
- Microsoft Corporation (MSFT) – 9.82%
- Amazon.com, Inc. (AMZN) – 6.40%
- Alphabet, Inc. (GOOGL) – 4.65%
- Broadcom Inc. (AVGO) – 4.50%
- Alphabet Inc. (GOOG) – 4.35%
- Meta Platforms, Inc. (META) – 1.58%
- Tesla, Inc. (TSLA) – 3.52%
- Fidelity Securities Lending Cash Central Fund – 2.95%
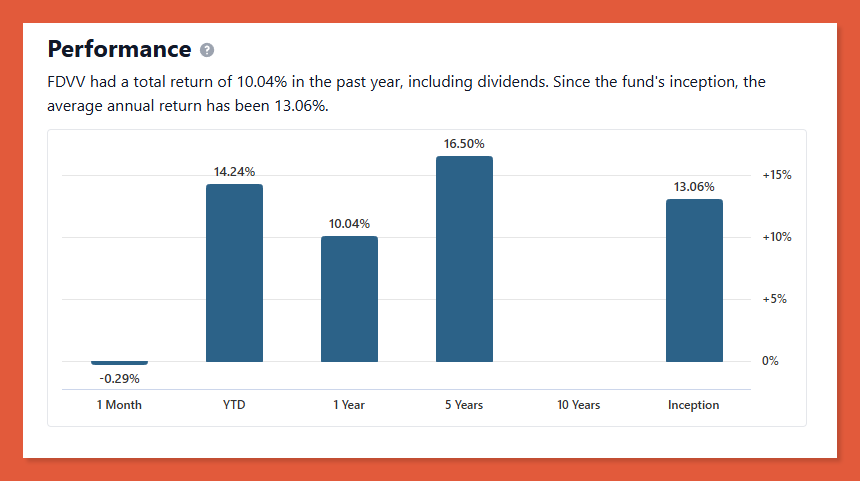
Best Fidelity ETF #5: Fidelity High Dividend ETF (FDVV)
Assets Under Management: $7.3 billion
Dividend Yield: 3.09%
Expense Ratio: 0.16%
Number of Holdings: 120+
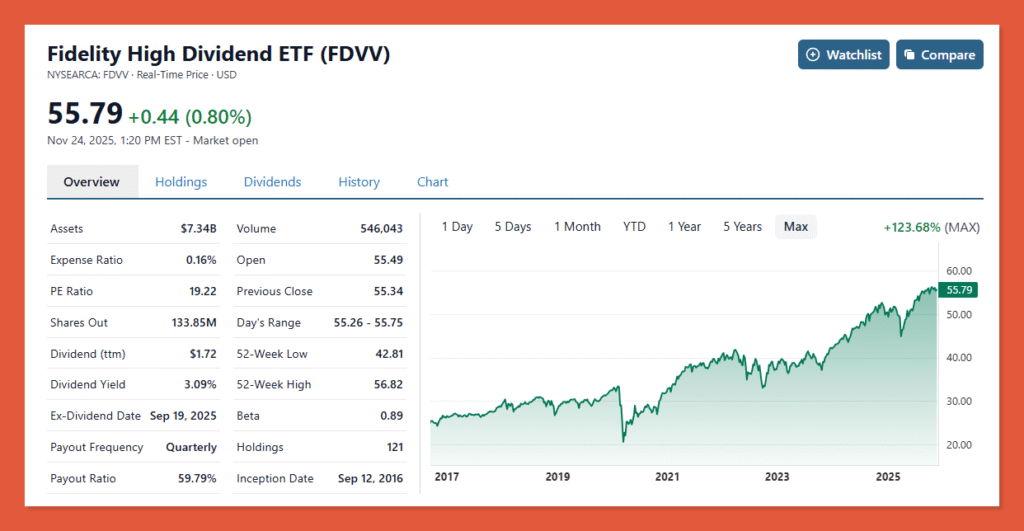
The Fidelity High Dividend ETF focuses on high-quality U.S. stocks with above-average dividend yields and growth potential.
FDVV uses a proprietary selection process to identify approximately 120 stocks with attractive current yields, dividend growth prospects, and financial sustainability. The fund emphasizes quality over pure yield maximization.
Unlike many high-yield strategies that chase maximum yields, FDVV balances current income with dividend growth and company quality. This approach aims for sustainable dividends that grow over time.
With $7.3 billion in assets, a 3.09% dividend yield, and 0.16% expense ratio, FDVV provides high-quality dividend exposure. The fund appeals to income investors seeking both current yield and dividend growth.
Top 10 Holdings:
- NVIDIA Corporation (NVDA) – 6.59%
- Apple Inc. (AAPL) –5.87%
- Microsoft Corporation (MSFT) – 5.29%
- Broadcom Inc. (AVGO) – 3.09%
- JPMorgan Chase & Co. (JPM) – 2.71%
- ABN AMRO Bank N.V. (ABN) – 2.30%
- Exxon Mobil (JPM) – 2.07%
- Visa Inc. (V) – 2.04%
- Philip Morris International Inc. (PM) – 2.00%
- The Coca-Cola Company (KO)– 1.97%
Best Fidelity ETF #6: Fidelity Enhanced Large Cap Core ETF (FELC)
Assets Under Management: $5.5 billion
Dividend Yield: 0.96%
Expense Ratio: 0.18%
Number of Holdings: 450+
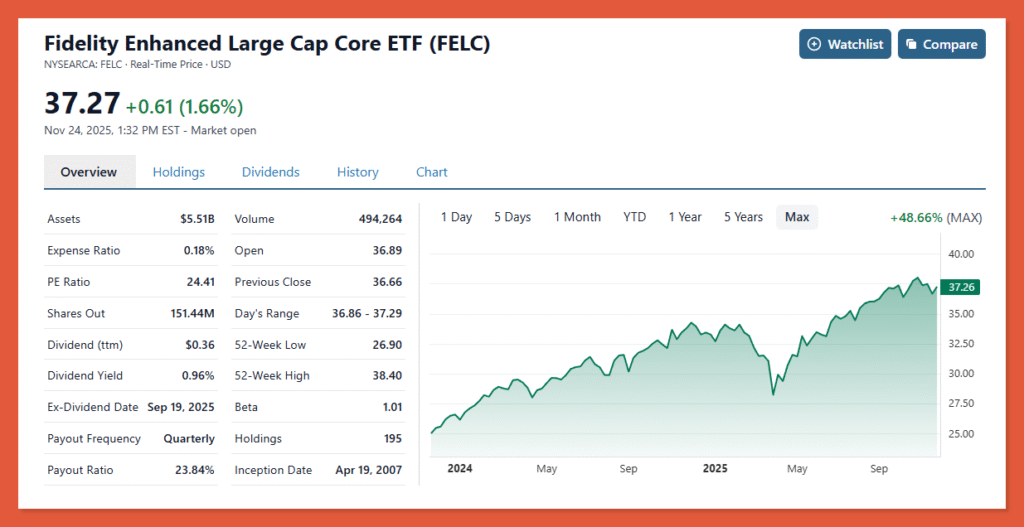
The Fidelity Enhanced Large Cap Core ETF employs factor-based strategies to outperform standard large-cap indexes.
FELC starts with a broad large-cap universe and applies quantitative screens for quality, value, and momentum factors. The fund systematically overweights stocks exhibiting favorable factor characteristics.
This enhanced indexing approach aims to deliver better risk-adjusted returns than market-cap-weighted large-cap indexes while maintaining broad diversification. The factor tilt adds active elements at relatively low cost.
With $5.5 billion in assets and a 0.18% expense ratio, FELC offers enhanced large-cap exposure. The 0.96% dividend yield is reasonable for a core equity fund with growth and value exposure.
Top 10 Holdings:
- NVIDIA Corporation (NVDA) – 7.91%
- Apple Inc. (AAPL) –7.41%
- Microsoft Corporation (MSFT) – 5.52%
- Broadcom Inc. (AVGO) – 3.34%
- Amazon.com, Inc (AMZN) – 4.04%
- Alphabet, Inc. (GOOGL) – 2.97%
- Alphabet Inc. (GOOG) – 2.74%
- Meta Platforms, Inc. (META) – 2.67%
- Berkshire Hathaway Inc (BRK.B) – 2.16%
- Tesla, Inc. (KO)– 1.97%
Best Fidelity ETF #7: Fidelity Enhanced International ETF (FENI)
Assets Under Management: $5.0 billion
Dividend Yield: 2.56%
Expense Ratio: 0.28%
Number of Holdings: 450+
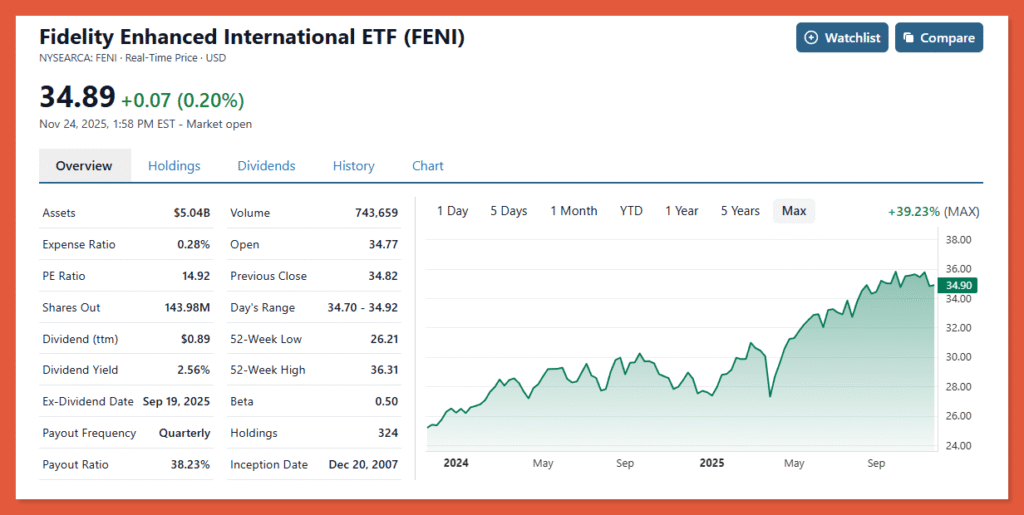
The Fidelity Enhanced International ETF applies factor-based strategies to international developed market stocks.
FENI holds approximately 450 international stocks from developed markets outside the United States, using quantitative factors to enhance returns. The fund targets quality, value, and momentum characteristics in international equities.
International stocks provide geographic diversification and exposure to different economic cycles than U.S. markets. FENI’s factor approach aims to outperform standard international indexes.
With $5.0 billion in assets, a 2.56% dividend yield, and 0.28% expense ratio, FENI offers enhanced international exposure. The higher yield reflects international markets’ stronger dividend culture compared to U.S. stocks.
Top 10 Holdings:
- ASML Holding N.V. (ASML) – 2.59%
- Nestlé S.A. (NESN) – 1.69%
- Novartis AG (NOVN) – 1.62%
- Toyota Motor Corporation (7203) – 1.41%
- Sony Group Corporation (6758) – 1.40%
- Siemens Aktiengesellschaft (SIE) – 1.40%
- Hitachi, Ltd. (6501) – 1.27%
- HSBC Holdings plc (HSBA) – 1.25%
- Fidelity Cash Central Fund (N/A) – 1.23%
- Iberdrola, S.A. (IBE) – 1.23%
Best Fidelity ETF #8: Fidelity Blue Chip Growth ETF (FBCG)
Assets Under Management: $4.9 billion
Dividend Yield: 0.11%
Expense Ratio: 0.59%
Number of Holdings: 100+
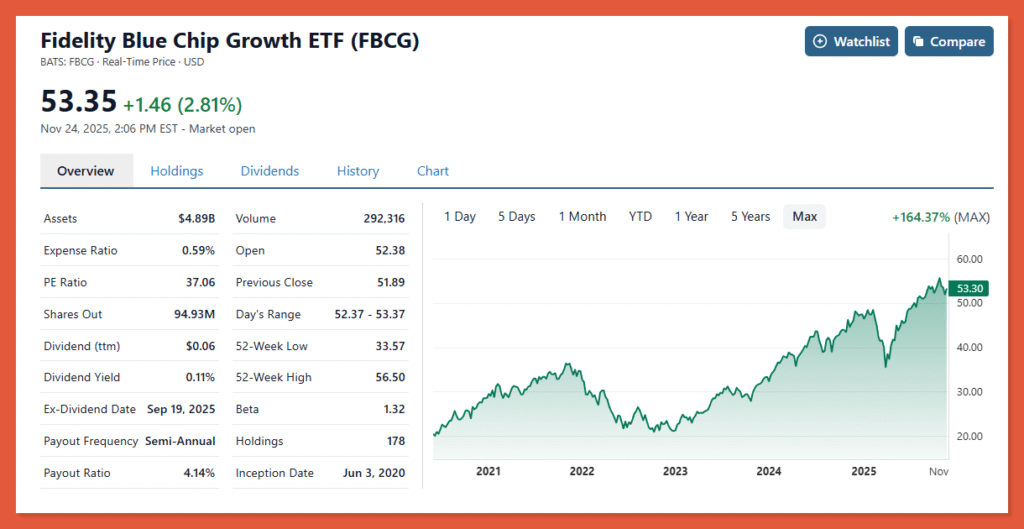
The Fidelity Blue Chip Growth ETF is an actively managed fund focused on large-cap growth companies with sustainable competitive advantages.
FBCG employs Fidelity’s fundamental research analysts to select approximately 100 large-cap growth stocks. The fund seeks companies with strong business models, pricing power, and long-term growth prospects.
As Fidelity’s only actively managed equity ETF with significant scale, FBCG represents the firm’s high-conviction growth ideas. The concentrated portfolio reflects active management with meaningful position sizes.
The 0.59% expense ratio is significantly higher than passive index funds but competitive for active management. The minimal 0.11% dividend yield reflects the fund’s pure growth focus.
Top 10 Holdings:
- NVIDIA Corporation (NVDA) – 16.19%
- Apple Inc. (AAPL) – 9.22%
- Microsoft Corporation (MSFT) – 7.75%
- Amazon.com, Inc. (AMZN) – 7.52%
- Alphabet, Inc. (GOOGL) – 2.59%
- Meta Platforms, Inc. (META) – 5.01%
- Broadcom Inc. (AVGO) – 3.04%
- Netflix, Inc. (NFLX) – 2.90%
- AppLovin Corporation (APP) – 2.10%
- Eli Lilly and Company (LLY) – 1.98%
Best Fidelity ETF #9: Fidelity Enhanced Large Cap Growth ETF (FELG)
Assets Under Management: $4.4 billion
Dividend Yield: 0.40%
Expense Ratio: 0.18%
Number of Holdings: 200+
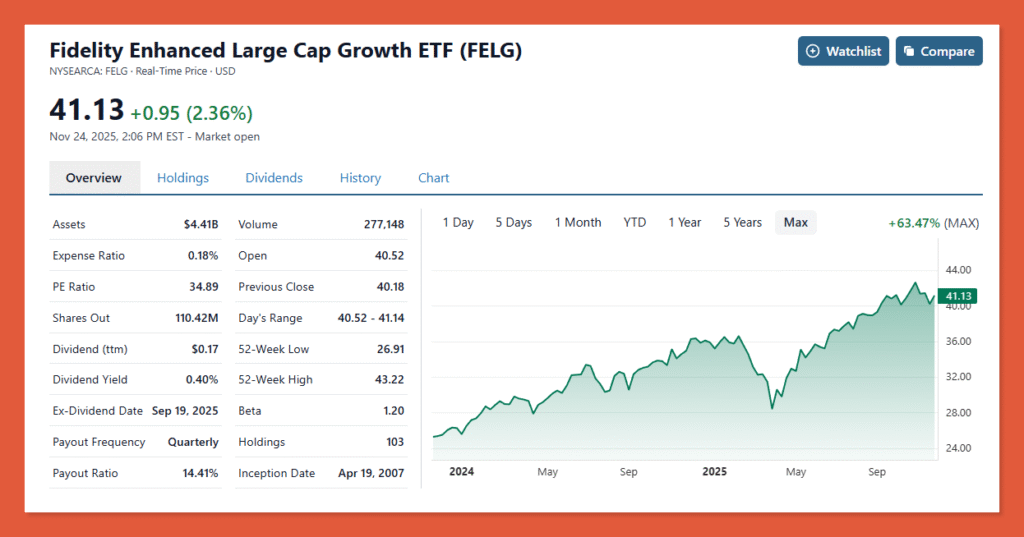
The Fidelity Enhanced Large Cap Growth ETF uses factor strategies to outperform traditional large-cap growth indexes.
FELG holds approximately 200 large-cap growth stocks selected through quantitative screens for momentum, quality, and growth characteristics. The fund systematically tilts toward stocks with favorable factor exposures.
This enhanced approach aims to capture large-cap growth returns with additional factor premiums. The strategy maintains broad diversification while targeting outperformance through systematic factor tilts.
With $4.4 billion in assets and a 0.18% expense ratio, FELG provides enhanced growth exposure at low cost. The 0.40% dividend yield is typical for growth-focused strategies.
Top 10 Holdings:
- NVIDIA Corporation (NVDA) – 13.24%
- Apple Inc. (AAPL) – 12.60%
- Microsoft Corporation (MSFT) – 10.28%
- Amazon.com, Inc. (AMZN) – 3.76%
- Alphabet, Inc. (GOOGL) – 3.49%
- Meta Platforms, Inc. (META) – 5.01%
- Broadcom Inc. (AVGO) – 5.38%
- Tesla, Inc. (TSLA) – 4.00%
- Alphabet Inc. (GOOG) – 3.43%
- Eli Lilly and Company (LLY) – 2.46%
Best Fidelity ETF #10: Fidelity Investment Grade Securitized ETF (FSEC)
Assets Under Management: $4.3 billion
Dividend Yield: 3.54%
Expense Ratio: 0.36%
Number of Holdings: 600+
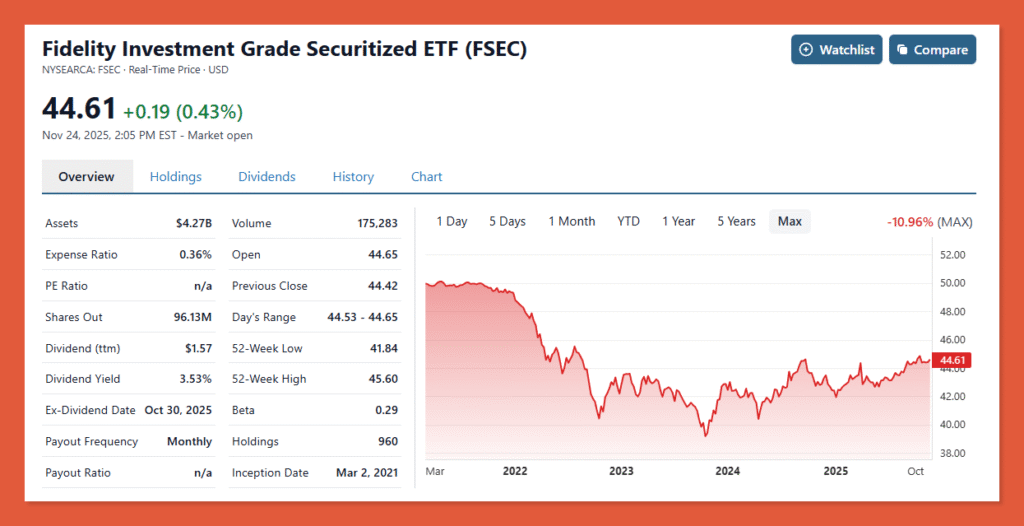
The Fidelity Investment Grade Securitized ETF focuses on mortgage-backed securities, asset-backed securities, and collateralized securities.
FSEC invests in securitized bonds backed by pools of mortgages, auto loans, credit card receivables, and other consumer debt. The fund targets investment-grade securities with monthly cash flows.
Securitized bonds offer higher yields than government bonds while maintaining investment-grade credit quality. The fund provides diversification across different securitization structures and underlying collateral types.
With $4.3 billion in assets and a 3.54% dividend yield, FSEC appeals to income investors seeking alternatives to traditional corporate bonds. The 0.36% expense ratio covers active management of complex securitized instruments.
Note: Bond ETF holdings consist primarily of individual securities rather than stocks.
Best Fidelity ETF #11: Fidelity Enhanced Mid Cap ETF (FMDE)
Assets Under Management: $4.1 billion
Dividend Yield: 1.25%
Expense Ratio: 0.23%
Number of Holdings: 350+
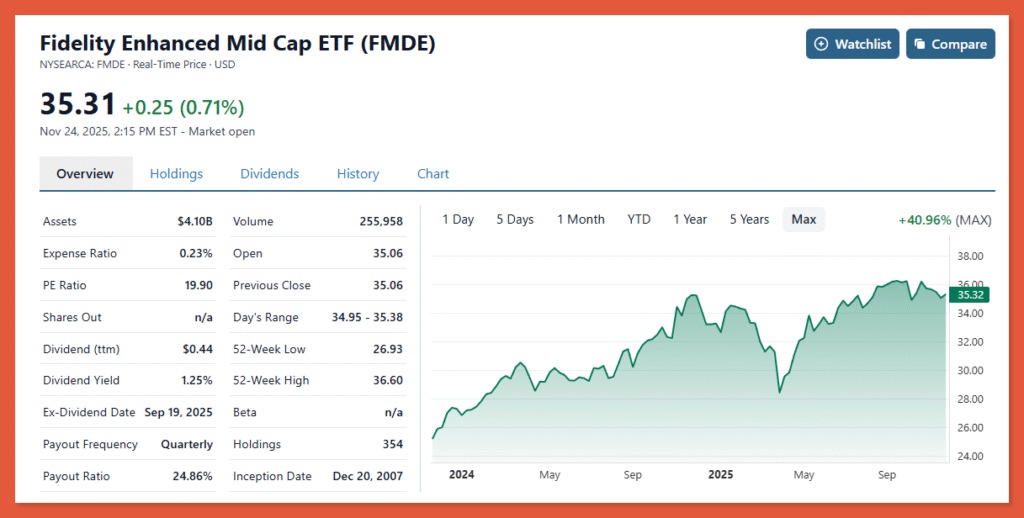
The Fidelity Enhanced Mid Cap ETF applies factor strategies to mid-cap stocks for enhanced returns.
FMDE holds approximately 350 mid-cap stocks selected through quantitative screens for quality, value, and momentum. The fund targets the attractive risk-return profile of mid-caps while adding systematic factor exposure.
Mid-cap stocks historically provide superior growth potential compared to large-caps with less volatility than small-caps. FMDE’s factor approach aims to enhance these natural mid-cap advantages.
With $4.1 billion in assets, a 1.25% dividend yield, and 0.23% expense ratio, FMDE offers enhanced mid-cap exposure. The fund appeals to investors seeking mid-cap growth with systematic return enhancements.
Top 10 Holdings:
- Fidelity Cash Central Fund (N/A) – 1.46%
- Howmet Aerospace Inc. (HWM) – 1.17%
- The Bank of New York Mellon Corporation (BK) – 1.14%
- Marathon Petroleum Corporation (MPC) – 1.01%
- The Allstate Corporation (ALL) – 0.98%
- Ford Motor Company (F) – 0.94%
- Cardinal Health, Inc. (CAH) – 0.94%
- Kinder Morgan, Inc. (KMI) – 0.94%
- Electronic Arts Inc. (EA) – 0.92%
- Western Digital Corporation (WDC) – 0.87%
Best Fidelity ETF #12: Fidelity Enhanced Small Cap ETF (FESM)
Assets Under Management: $2.8 billion
Dividend Yield: 1.07%
Expense Ratio: 0.28%
Number of Holdings: 650+
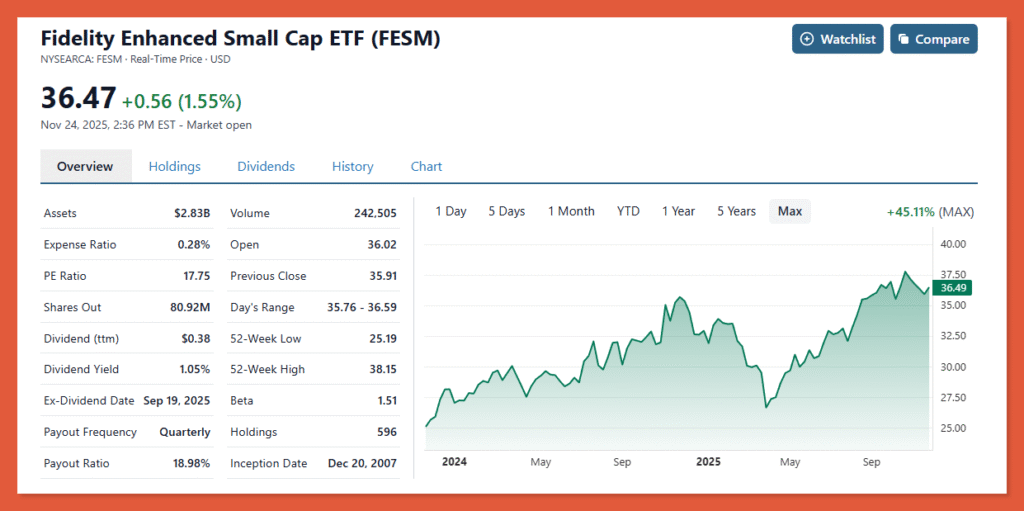
The Fidelity Enhanced Small Cap ETF uses factor strategies to capture small-cap premiums with enhanced risk-adjusted returns.
FESM holds approximately 650 small-cap stocks selected for favorable quality, value, and momentum characteristics. The fund provides broad small-cap diversification with systematic factor tilts.
Small-cap stocks offer higher long-term return potential but come with elevated volatility. FESM’s factor approach aims to capture small-cap returns while managing downside risk through quality screens.
With $2.8 billion in assets and a 0.28% expense ratio, FESM provides enhanced small-cap exposure. The 1.07% dividend yield is modest, reflecting small-cap companies’ focus on growth over dividends.
Top 10 Holdings:
- Fidelity Securities Lending Cash Central Fund (N/A) – 4.67%
- Fidelity Cash Central Fund (N/A) – 1.45%
- Guardant Health, Inc. (GH) – 1.04%
- Bloom Energy Corporation (BE) – 0.99%
- Fabrinet (FN) – 0.99%
- Credo Technology Group Holding Ltd (CRDO) – 0.86%
- Kratos Defense & Security Solutions, Inc. (CRDO) – 0.86%
- Coeur Mining, Inc. (CDE) – 0.86%
- Hecla Mining Company (CDE) – 0.81%
- CareTrust REIT, Inc. (CTRE) – 0.80%
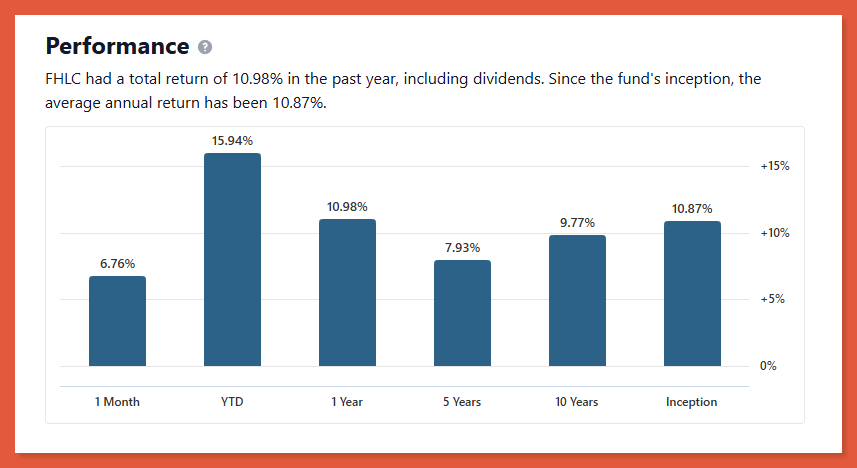
Best Fidelity ETF #13: Fidelity MSCI Health Care Index ETF (FHLC)
Assets Under Management: $2.8 billion
Dividend Yield: 1.36%
Expense Ratio: 0.08%
Number of Holdings: 450+
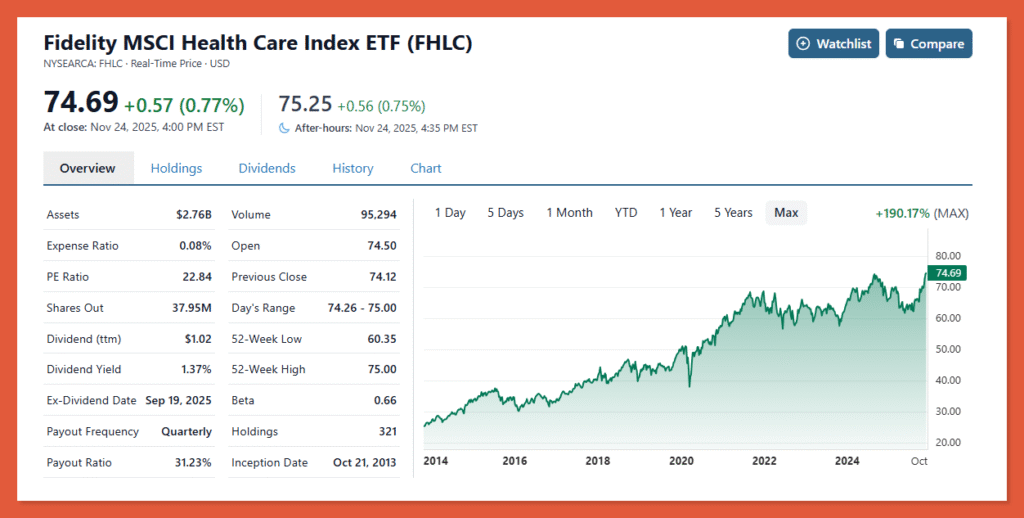
The Fidelity MSCI Health Care Index ETF provides comprehensive healthcare sector exposure across pharmaceuticals, biotechnology, medical devices, and healthcare services.
FHLC tracks the MSCI USA IMI Health Care Index, holding approximately 450 healthcare stocks across all market capitalizations. The fund captures the entire U.S. healthcare sector.
Healthcare benefits from aging demographics, medical innovation, and relatively inelastic demand. The sector offers both growth potential from biotechnology and stability from established pharmaceutical companies.
With $2.8 billion in assets and a rock-bottom 0.08% expense ratio, FHLC offers cost-effective healthcare exposure. The 1.36% dividend yield reflects healthcare companies’ balance between R&D investment and shareholder returns.
Top 10 Holdings:
- Eli Lilly and Company (LLY) –12.78%
- Johnson & Johnson (JNJ) – 7.45%
- AbbVie Inc. (ABBV) – 6.42%
- UnitedHealth Group Incorporated (UNH) – 4.51%
- Merck & Co., Inc. (MRK) – 3.62%
- Abbott Laboratories (ABT) – 3.51%
- Thermo Fisher Scientific Inc. (TMO) – 3.32%
- Intuitive Surgical, Inc. (ISRG) – 3.04%
- Amgen Inc. (AMGN) – 2.85%
- Gilead Sciences, Inc. (GILD) – 2.40%
Best Fidelity ETF #14: Fidelity Enhanced Large Cap Value ETF (FELV)
Assets Under Management: $2.4 billion
Dividend Yield: 1.74%
Expense Ratio: 0.18%
Number of Holdings: 200+
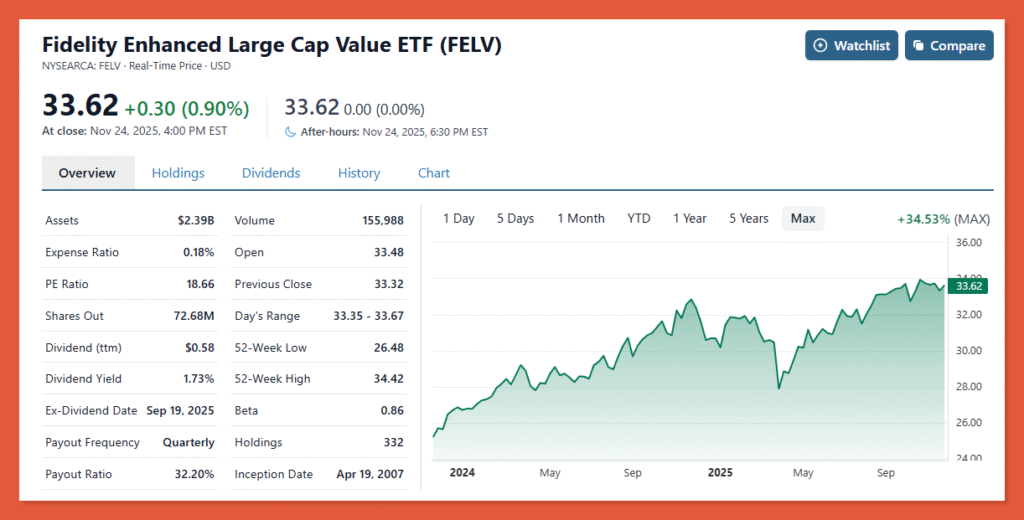
The Fidelity Enhanced Large Cap Value ETF applies factor strategies to large-cap value stocks.
FELV holds approximately 200 large-cap value stocks selected through quantitative screens emphasizing value, quality, and momentum factors. The fund systematically overweights undervalued stocks with strong fundamentals.
Value investing has a long history of outperformance over full market cycles. FELV’s enhanced approach adds factor tilts to traditional value investing for improved risk-adjusted returns.
With $2.4 billion in assets, a 1.74% dividend yield, and 0.18% expense ratio, FELV provides enhanced value exposure. The higher yield reflects value stocks’ income orientation compared to growth stocks.
Top 10 Holdings:
- Berkshire Hathaway Inc. (BRK.B) –3.70%
- JPMorgan Chase & Co. (JPM) –2.82%
- Amazon.com, Inc. (AMZN) –2.29%
- Alphabet, Inc. (GOOGL) –2.11%
- Alphabet Inc. (GOOG) –1.82%
- Exxon Mobil Corporation (XOM) –1.58%
- Walmart Inc. (WMT) –1.40%
- Bank of America Corporation (BAC) –1.29%
- Merck & Co., Inc. (MRK) –1.20%
- The Procter & Gamble Company (PG) –1.17%
Best Fidelity ETF #15: Fidelity MSCI Financials Index ETF (FNCL)
Assets Under Management: $2.3 billion
Dividend Yield: 1.53%
Expense Ratio: 0.08%
Number of Holdings: 350+
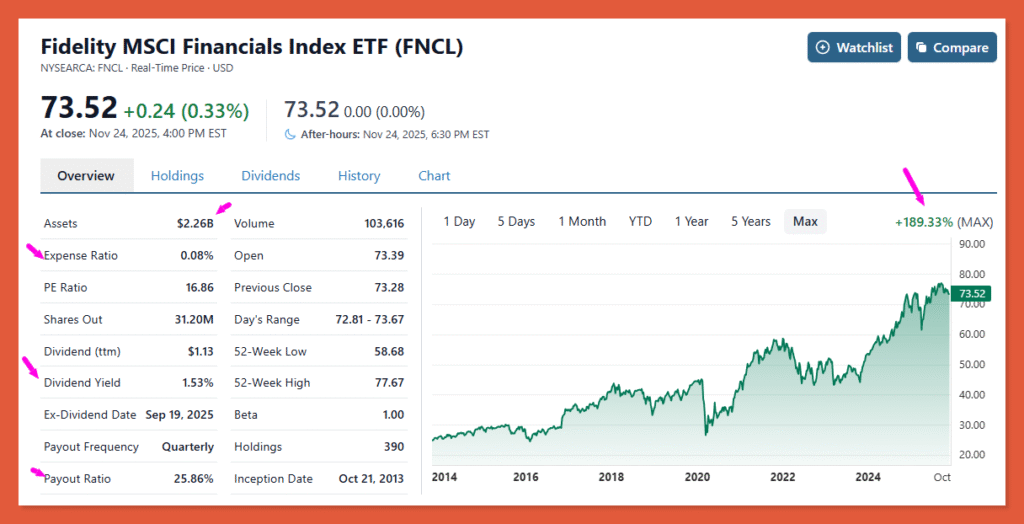
The Fidelity MSCI Financials Index ETF provides exposure to the financial services sector including banks, insurance, asset managers, and payment processors.
FNCL tracks the MSCI USA IMI Financials Index, holding approximately 350 financial stocks across all market capitalizations. The fund captures the entire U.S. financial sector.
Financial stocks benefit from economic growth, rising interest rates, and expanding loan volumes. The sector includes both stable dividend-paying banks and high-growth fintech companies.
With $2.3 billion in assets and a 0.08% expense ratio, FNCL offers cost-effective financial sector exposure. The 1.53% dividend yield reflects financials’ tradition of returning capital through dividends.
Top 10 Holdings:
- JPMorgan Chase & Co. (JPM) –10.00%
- Berkshire Hathaway Inc. (BRK.B) –8.17%
- Visa Inc. (V) –6.68%
- Mastercard Incorporated (MA) –4.41%
- Bank of America Corporation (BAC) –3.70%
- Wells Fargo & Company (WFC) –3.22%
- The Goldman Sachs Group, Inc. (GS) –2.29%
- Morgan Stanley (MS) –3.70%
- American Express (AXP) –2.29%
- Citigroup Inc. (C) –2.17%
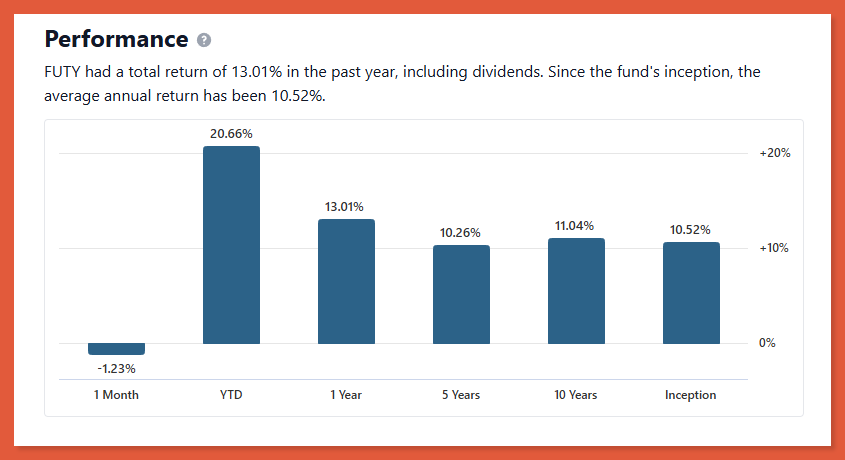
Best Fidelity ETF #16: Fidelity MSCI Utilities Index ETF (FUTY)
Assets Under Management: $2.2 billion
Dividend Yield: 2.56%
Expense Ratio: 0.08%
Number of Holdings: 65+
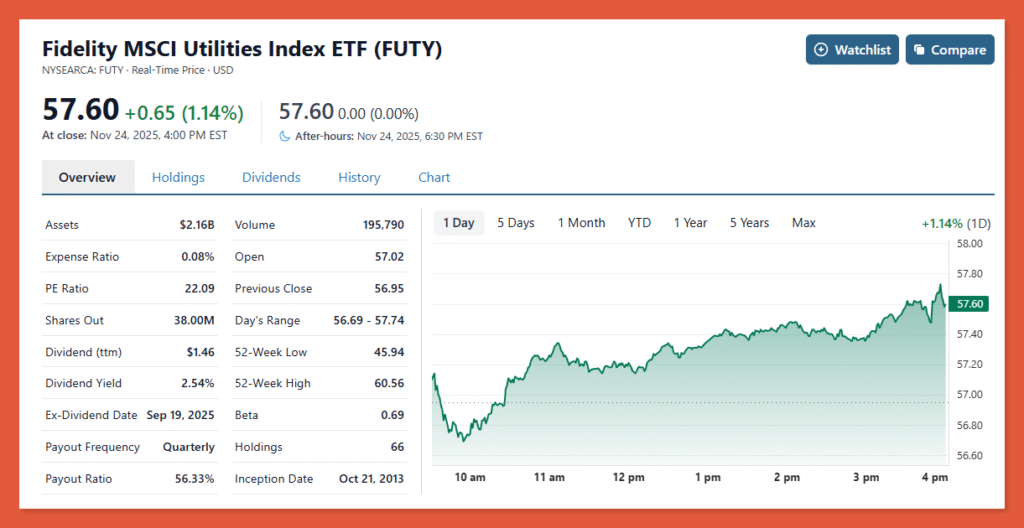
The Fidelity MSCI Utilities Index ETF focuses on electric utilities, gas utilities, water utilities, and independent power producers.
FUTY tracks the MSCI USA IMI Utilities Index, holding approximately 65 utility stocks. The fund provides concentrated exposure to this defensive, income-generating sector.
Utilities generate stable cash flows from regulated monopolies, making them relatively defensive investments during economic uncertainty. The sector’s steady dividends appeal to income investors seeking reliability.
With $2.2 billion in assets, a 2.56% dividend yield, and 0.08% expense ratio, FUTY offers defensive sector exposure. The higher yield and lower volatility make utilities attractive during market turbulence.
Top 10 Holdings:
- NextEra Energy, Inc. (NEE) –11.51%
- Constellation Energy Corporation (CEG) –6.92%
- The Southern Company (SO) –6.49%
- Duke Energy Corporation (DUK) –6.34%
- American Electric Power Company, Inc. (AEP) –4.31%
- Sempra (SRE) –3.92%
- Vistra Corp. (VST) –3.87%
- Dominion Energy, Inc. (D) –3.42%
- Exelon Corporation (EXC) –3.07%
- Xcel Energy Inc. (XLE) –3.06%
Best Fidelity ETF #17: Fidelity Ethereum Fund ETF (FETH)
Assets Under Management: $1.9 billion
Dividend Yield: None
Expense Ratio: 0.25%
Number of Holdings: Ethereum only
The Fidelity Ethereum Fund ETF provides direct exposure to Ethereum, the second-largest cryptocurrency by market capitalization.
FETH holds actual Ethereum, offering investors access to this cryptocurrency through traditional brokerage accounts. The fund tracks Ethereum’s spot price with minimal tracking error.
Ethereum powers smart contracts, decentralized finance (DeFi), and non-fungible tokens (NFTs). The fund provides exposure to Ethereum’s growth potential without requiring cryptocurrency exchanges or digital wallets.
With $1.9 billion in assets and a 0.25% expense ratio, FETH offers institutional-grade Ethereum exposure. The fund appeals to investors seeking cryptocurrency diversification beyond Bitcoin.
Holdings: 100% Ethereum (ETH)
Best Fidelity ETF #18: Fidelity MSCI Communication Services Index ETF (FCOM)
Assets Under Management: $1.8 billion
Dividend Yield: 0.89%
Expense Ratio: 0.08%
Number of Holdings: 115+
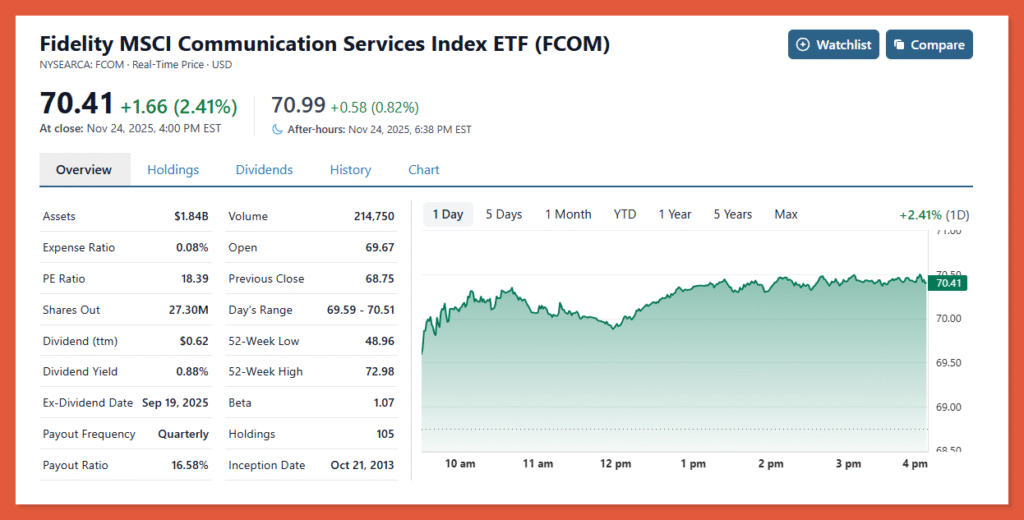
The Fidelity MSCI Communication Services Index ETF provides exposure to telecommunications, media, entertainment, and interactive media companies.
FCOM tracks the MSCI USA IMI Communication Services Index, holding approximately 115 stocks including major telecommunications providers, media companies, and social media platforms.
The communication services sector combines traditional telecom with new media and internet companies. The sector benefits from secular growth in digital advertising, streaming content, and 5G connectivity.
With $1.8 billion in assets and a 0.08% expense ratio, FCOM offers cost-effective communication services exposure. The 0.89% dividend yield is modest, reflecting the sector’s mix of growth-oriented tech platforms and mature telecom dividend payers.
Top 10 Holdings:
- Alphabet, Inc. (GOOGL) –17.75%
- Meta Platforms, Inc. (META) –17.11%
- Alphabet Inc. (GOOG) –13.43%
- The Walt Disney Company. (DIS) –4.04%
- Netflix, Inc. (NFLX) –3.98%
- AT&T Inc. (T) –3.92%
- Verizon Communications Inc. (VZ) –3.79%
- Warner Bros. Discovery, Inc. (WDB) –2.66%
- T-Mobile US, Inc. (TMUS) –2.66%
- Comcast Corporation. (CMCSA) –2.47%
Best Fidelity ETF #19: Fidelity MSCI Consumer Discretionary Index ETF (FDIS)
Assets Under Management: $1.8 billion
Dividend Yield: 0.77%
Expense Ratio: 0.08%
Number of Holdings: 280+
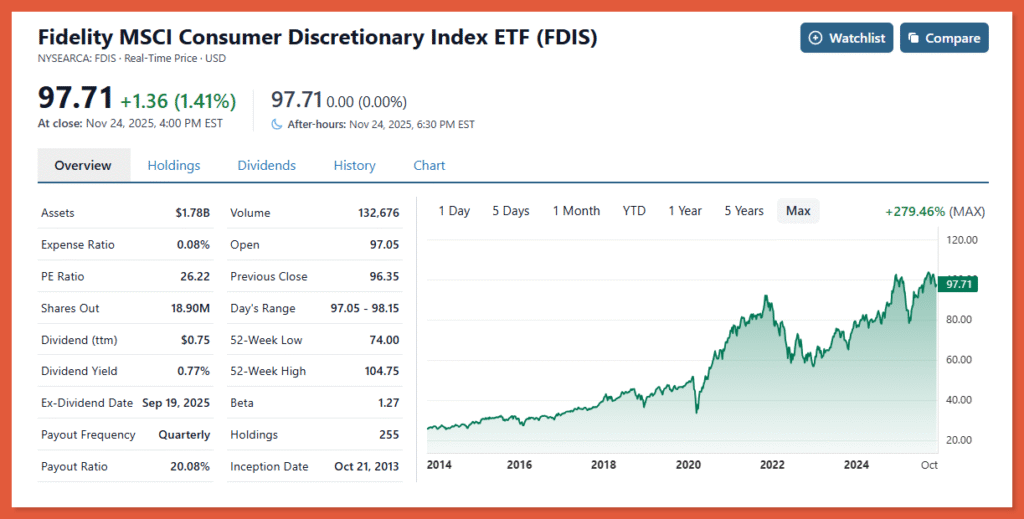
The Fidelity MSCI Consumer Discretionary Index ETF provides exposure to consumer discretionary companies including retail, automotive, restaurants, and leisure.
FDIS tracks the MSCI USA IMI Consumer Discretionary Index, holding approximately 280 consumer discretionary stocks. The fund captures companies selling non-essential goods and services.
Consumer discretionary stocks perform well during economic expansions when consumer spending increases. The sector includes e-commerce giants, automotive manufacturers, and restaurant chains.
With $1.8 billion in assets and a 0.08% expense ratio, FDIS offers consumer discretionary exposure. The 0.77% dividend yield is low, reflecting the sector’s focus on growth and reinvestment over dividends.
Top 10 Holdings: [Add top 10 holdings here]
Best Fidelity ETF #20: Fidelity Small-Mid Multifactor ETF (FSMD)
Assets Under Management: $1.8 billion
Dividend Yield: 1.39%
Expense Ratio: 0.16%
Number of Holdings: 550+
The Fidelity Small-Mid Multifactor ETF applies multiple factor strategies to small and mid-cap stocks.
FSMD holds approximately 550 small and mid-cap stocks selected through quantitative screens for quality, value, momentum, and low volatility. The multifactor approach combines several proven return drivers.
Small and mid-cap stocks offer higher growth potential than large-caps. FSMD’s multifactor strategy aims to enhance returns while managing risk through diversified factor exposure.
With $1.8 billion in assets, a 1.39% dividend yield, and 0.16% expense ratio, FSMD provides sophisticated factor exposure to smaller companies. The fund appeals to investors seeking systematic outperformance in the small and mid-cap space.
Top 10 Holdings:
- Amazon.com, Inc. (AMZN) –24.06%
- Tesla, Inc. (TSLA) –17.62%
- The Home Depot, Inc. (HD) –5.09%
- McDonald’s Corporation (MCD) –3.36%
- The TJX Companies, Inc. (TJX) –2.53%
- Booking Holdings Inc. (BKNG) –2.45%
- Lowe’s Companies, Inc. (LOW) –1.97%
- Starbucks Corporation. (SBUX) –1.48%
- MercadoLibre, Inc. (MELI) –1.47%
- O’Reilly Automotive, Inc. (ORLY) –1.35%
Best Fidelity ETF #21: Fidelity Low Volatility Factor ETF (FDLO)
Assets Under Management: $1.4 billion
Dividend Yield: 1.39%
Expense Ratio: 0.16%
Number of Holdings: 125+
The Fidelity Low Volatility Factor ETF focuses on stocks with below-average price volatility and stable returns.
FDLO holds approximately 125 U.S. stocks with historically low volatility characteristics. The fund targets companies with stable earnings, consistent cash flows, and less dramatic price swings.
Low volatility investing has historically provided better risk-adjusted returns than the broad market. FDLO appeals to conservative investors seeking equity exposure with reduced volatility.
With $1.4 billion in assets, a 1.39% dividend yield, and 0.16% expense ratio, FDLO offers defensive equity exposure. The fund performs best during market downturns when high-volatility stocks decline more sharply.
Top 10 Holdings:
- Apple Inc. (ABUX) –1.48%
- Microsoft Corporation (ABUX) –1.48%
- Alphabet, Inc. (ABUX) –1.48%
- Broadcom Inc. (ABUX) –1.48%
- Amazon.com, Inc. (ABUX) –1.48%
- Meta Platforms, Inc. (ABUX) –1.48%
- Berkshire Hathaway Inc. (ABUX) –1.48%
- Eli Lilly and Company (ABUX) –1.48%
- JPMorgan Chase & Co. (ABUX) –1.48%
- Cisco Systems, Inc. (ABUX) –1.48%
Best Fidelity ETF #22: Fidelity MSCI Industrial Index ETF (FIDU)
Assets Under Management: $1.4 billion
Dividend Yield: 1.37%
Expense Ratio: 0.08%
Number of Holdings: 370+
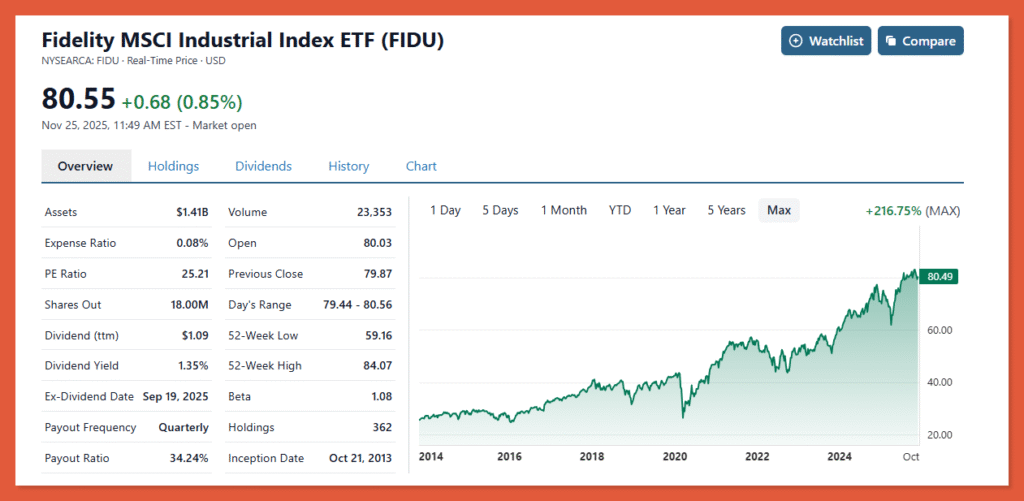
The Fidelity MSCI Industrial Index ETF provides exposure to the industrial sector including aerospace, defense, machinery, and transportation.
FIDU tracks the MSCI USA IMI Industrials Index, holding approximately 370 industrial stocks. The fund captures companies that manufacture and transport goods globally.
Industrial stocks benefit from economic growth, infrastructure spending, and global trade expansion. The sector includes cyclical manufacturers alongside stable aerospace and defense contractors.
With $1.4 billion in assets and a 0.08% expense ratio, FIDU offers cost-effective industrial sector exposure. The 1.37% dividend yield reflects industrials’ moderate income characteristics.
Top 10 Holdings:
- General Electric Company (ABUX) –1.48%
- Caterpillar Inc. (ABUX) –1.48%
- RTX Corporation (ABUX) –1.48%
- Uber Technologies, Inc. (ABUX) –1.48%
- GE Vernova Inc. (ABUX) –1.48%
- The Boeing Company. (ABUX) –1.48%
- Eaton Corporation plc. (ABUX) –1.48%
- Union Pacific Corporation. (ABUX) –1.48%
- Honeywell International Inc. (ABUX) –1.48%
- Deere & Company. (ABUX) –1.48%
Best Fidelity ETF #23: Fidelity MSCI Consumer Staples Index ETF (FSTA)
Assets Under Management: $1.3 billion
Dividend Yield: 2.29%
Expense Ratio: 0.08%
Number of Holdings: 100+
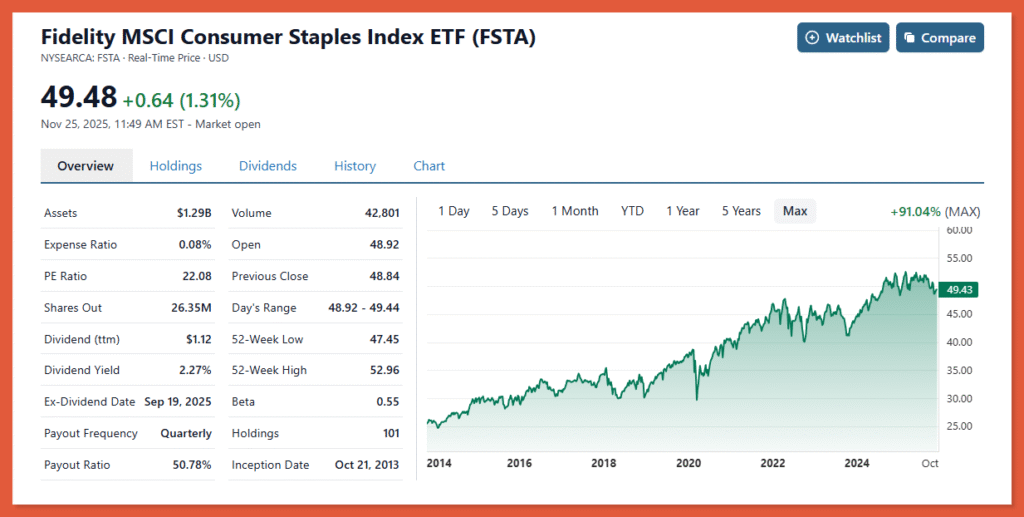
The Fidelity MSCI Consumer Staples Index ETF focuses on companies producing essential consumer products including food, beverages, household items, and personal care products.
FSTA tracks the MSCI USA IMI Consumer Staples Index, holding approximately 100 consumer staples stocks. The fund provides exposure to defensive companies selling necessities.
Consumer staples perform relatively well during recessions as demand for essential products remains stable. The sector offers defensive characteristics and consistent dividends.
With $1.3 billion in assets, a 2.29% dividend yield, and 0.08% expense ratio, FSTA provides defensive sector exposure. The higher yield and lower volatility make consumer staples attractive during uncertain economic periods.
Top 10 Holdings: [Add top 10 holdings here]
- Walmart Inc. (WMT) –14.51%
- Costco Wholesale Corporation. (COST) –12.49%
- The Procter & Gamble Company. (PG) –10.94%
- The Coca-Cola Company. (KO) –9.01%
- PepsiCo, Inc. (PEP) –4.65%
- Philip Morris International Inc. (PM) –4.43%
- Altria Group, Inc. (MO) –3.39%
- Mondelez International, Inc. (MDLZ) –2.57%
- Colgate-Palmolive Company. (CL) –2.19%
- Monster Beverage Corporation. (MNST) –1.90%
Fidelity ETFs vs. Vanguard ETFs: Key Differences
While both Fidelity and Vanguard offer low-cost ETFs, several important distinctions differentiate these providers.
Expense Ratios
Vanguard typically offers lower expense ratios on broad market index funds, with many charging just 0.03-0.04%. Fidelity’s broad index funds charge 0.08-0.21%, slightly higher but still very competitive.
However, Fidelity’s factor and enhanced ETFs charge 0.16-0.28%, reasonable for strategies targeting outperformance. Both providers dramatically undercut industry averages.
Active vs. Passive Management
Vanguard focuses almost exclusively on pure passive indexing with minimal active management. Fidelity offers both passive index funds and enhanced/factor strategies with active elements.
Fidelity’s enhanced ETFs use quantitative factor models to systematically outperform indexes. This middle ground between pure passive and traditional active management appeals to investors seeking better risk-adjusted returns.
Cryptocurrency Exposure
Fidelity offers Bitcoin (FBTC) and Ethereum (FETH) ETFs, providing direct cryptocurrency exposure through traditional brokerage accounts. Vanguard has not entered the cryptocurrency ETF market.
This makes Fidelity attractive for investors seeking digital asset exposure without cryptocurrency exchanges or digital wallets.
Fund Selection
Vanguard offers broader international coverage with more developed and emerging market options. Fidelity provides more U.S. sector and factor funds with diverse strategies.
Both providers offer core broad market funds, but their specialized offerings differ based on investment philosophy and target markets.
Building Complete Portfolios with Fidelity ETFs
Investors can construct well-diversified portfolios using only Fidelity ETFs across multiple strategies and risk levels.
Conservative Portfolio (Lower Risk)
A conservative allocation might include 30% FTEC (Technology), 20% FBND (Total Bond), 20% FDVV (High Dividend), 15% FHLC (Healthcare), 10% FSTA (Consumer Staples), and 5% FUTY (Utilities).
This portfolio provides equity exposure for growth with substantial fixed income and defensive sectors for stability. The high dividend focus generates current income suitable for retirees or conservative investors.
Moderate Portfolio (Balanced Approach)
A balanced portfolio could use 35% FELC (Enhanced Large Cap Core), 25% FENI (Enhanced International), 20% FBND (Total Bond), 10% FMDE (Enhanced Mid Cap), and 10% FESM (Enhanced Small Cap).
This allocation balances growth and income across U.S. and international markets with diversified market capitalizations. The enhanced factor strategies target outperformance while maintaining broad diversification.
Aggressive Portfolio (Higher Risk)
Growth-focused investors might allocate 40% FELG (Enhanced Large Cap Growth), 25% FTEC (Technology), 15% FBCG (Blue Chip Growth), 10% ONEQ (Nasdaq Composite), and 10% FBTC (Bitcoin).
This stock-heavy portfolio targets maximum long-term capital appreciation through growth stocks, technology, and cryptocurrency. The allocation suits investors with long time horizons comfortable with volatility.
Factor-Based Portfolio
Sophisticated investors could construct 30% FELC (Core), 20% FELV (Value), 20% FELG (Growth), 15% FDLO (Low Volatility), and 15% FSMD (Small-Mid Multifactor).
This approach systematically captures multiple proven factors including value, momentum, quality, and low volatility. Factor diversification aims to enhance risk-adjusted returns across market environments.
Tax Efficiency of Fidelity ETFs
Fidelity ETFs provide superior tax efficiency compared to mutual funds through their structural advantages.
ETF Creation and Redemption Mechanism
ETFs use in-kind creation and redemption processes where shares are exchanged for securities rather than cash. This mechanism avoids taxable sales that mutual funds must make to meet redemptions.
Fidelity’s ETFs rarely distribute capital gains, allowing investors to defer taxes until selling. This tax deferral enhances compound growth in taxable accounts.
Low Turnover Index Strategies
Fidelity’s index funds trade infrequently, only adjusting when index compositions change. Low turnover minimizes trading costs and realized capital gains.
Even Fidelity’s enhanced and factor funds maintain relatively low turnover through systematic rebalancing schedules. This disciplined approach reduces unnecessary tax events.
Tax Loss Harvesting Opportunities
ETF liquidity enables tax loss harvesting where investors sell positions at losses to offset capital gains while maintaining market exposure through similar funds.
Fidelity’s diverse ETF lineup provides numerous substantially different options for tax loss harvesting, such as swapping FELC for ONEQ or FTEC for FBCG.
Frequently Asked Questions About Fidelity ETFs
How do I buy Fidelity ETFs?
Fidelity ETFs can be purchased through any brokerage account using the fund’s ticker symbol.
Open a brokerage account at Fidelity or another broker, fund your account, then search for the ETF ticker and place your order. ETFs trade throughout the day at market prices like individual stocks.
Fidelity customers enjoy commission-free ETF trades. Most other major brokers also offer commission-free ETF trading.
What is the minimum investment for Fidelity ETFs?
The minimum investment for Fidelity ETFs is the price of one share.
Unlike Fidelity mutual funds requiring $2,500 minimums for many offerings, ETFs have no minimum beyond the current share price. This accessibility benefits investors starting with small amounts.
For example, FTEC trading around $150 requires just $150 to purchase one share, providing instant technology sector exposure.
Do Fidelity ETFs pay dividends?
Yes, Fidelity ETFs pay dividends based on income received from their underlying holdings.
Equity ETFs collect dividends from stocks they own and distribute them to shareholders, typically quarterly. Bond ETFs collect interest and distribute monthly. Dividend amounts vary based on underlying holdings and fund strategy.
Investors can receive dividends as cash or automatically reinvest them to purchase additional shares through dividend reinvestment plans.
Are Fidelity ETFs better than Fidelity mutual funds?
Fidelity ETFs and mutual funds each offer advantages depending on investor needs.
ETFs provide intraday trading, lower minimums, superior tax efficiency, and ability to trade through any broker. Mutual funds offer automatic investments, fractional shares, and avoid intraday price volatility.
For taxable accounts, ETFs generally offer better tax efficiency. For retirement accounts where taxes don’t matter, the choice depends on personal preference for trading flexibility versus automatic investing.
How are Fidelity’s enhanced ETFs different from index funds?
Fidelity’s enhanced ETFs use factor-based strategies to systematically outperform market-cap-weighted indexes.
Enhanced funds start with broad market universes and apply quantitative screens for factors like quality, value, momentum, and low volatility. This systematic approach tilts portfolios toward stocks with favorable factor characteristics.
Traditional index funds simply replicate benchmarks with no attempt at outperformance. Enhanced ETFs add active factor exposure while maintaining relatively low costs and broad diversification.
Can I hold Fidelity ETFs in a 401(k) or IRA?
Yes, Fidelity ETFs can be held in IRAs, 401(k)s, and other tax-advantaged retirement accounts.
Holding ETFs in retirement accounts provides tax-deferred growth for traditional accounts or tax-free growth for Roth accounts. Dividends and capital gains generate no current tax liability.
Many investors use Fidelity ETFs as core holdings in retirement portfolios, benefiting from low costs and diversification within tax-sheltered accounts.
Do Fidelity ETFs have loads or commissions?
Fidelity ETFs have no loads, and commission-free trading is available at Fidelity and most major brokers.
Unlike some mutual funds charging front-end or back-end loads, ETFs have no sales charges. The expense ratio is the only ongoing cost.
Fidelity brokerage customers trade Fidelity ETFs commission-free. Other major brokers including Schwab, Vanguard, and TD Ameritrade also offer commission-free ETF trading.
What makes Fidelity’s Blue Chip Growth ETF different?
Fidelity Blue Chip Growth ETF (FBCG) is actively managed by Fidelity’s fundamental research analysts rather than tracking an index.
The fund represents Fidelity’s highest-conviction large-cap growth ideas selected through bottom-up fundamental research. Portfolio managers actively buy and sell based on company analysis and market conditions.
This active approach aims for outperformance but charges a higher 0.59% expense ratio. FBCG offers investors access to Fidelity’s research expertise in a transparent ETF structure.
Conclusion
Fidelity ETFs provide investors with diverse portfolio building blocks spanning U.S. stocks, international equities, bonds, sectors, factors, and even cryptocurrencies.
The 24 Fidelity ETFs ranked by assets under management include broad market funds like FTEC (Technology) and ONEQ (Nasdaq Composite) alongside innovative offerings like FBTC (Bitcoin) and enhanced factor strategies. Expense ratios ranging from 0.08% to 0.59% keep costs competitive.
Fidelity’s unique combination of passive index funds, enhanced factor strategies, and actively managed offerings differentiates it from pure index providers like Vanguard. Investors seeking systematic outperformance through factor investing find compelling options in Fidelity’s enhanced ETF lineup.
Understanding key investment terms like expense ratios, dividend yields, and factor investing helps investors select appropriate Fidelity ETFs. Whether building conservative income portfolios or aggressive growth strategies, Fidelity’s ETF lineup provides necessary components.
Investors can construct complete portfolios using only Fidelity ETFs, from simple core-satellite approaches to sophisticated multifactor allocations. The combination of low costs, tax efficiency, and diverse strategies makes Fidelity ETFs attractive for both beginning and experienced investors.
Disclaimer: This article is for informational purposes only and should not be considered investment advice. ETF performance, holdings, and characteristics change over time. Cryptocurrency investments carry significant risk including potential total loss. Always conduct your own research and consult with a financial advisor before making investment decisions.

