


What Is a Safe Dividend Payout Ratio? Answered
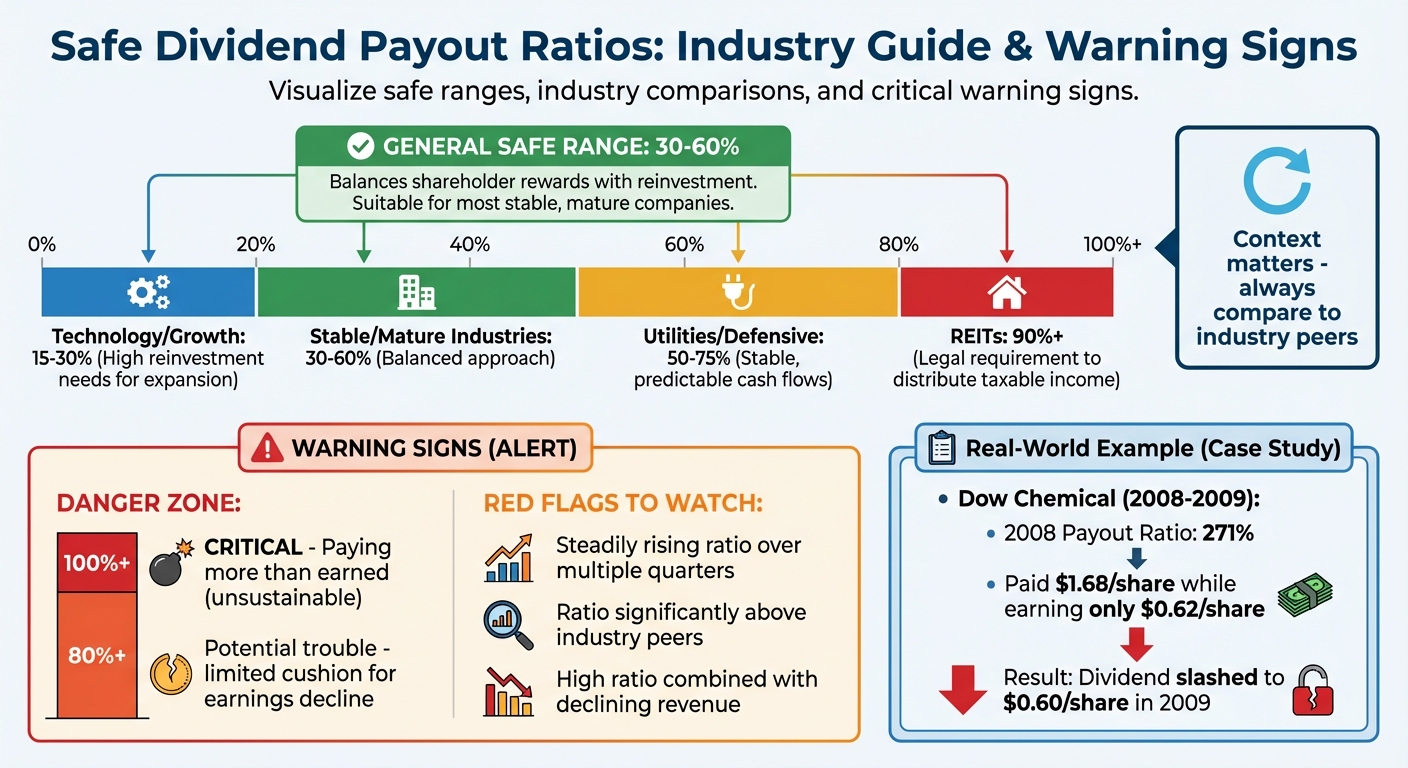
For dividend investors, a safe dividend payout ratio ensures a company can maintain its payments over time. A good range is typically 30%-60%, balancing shareholder rewards with reinvestment. Ratios above 80% may signal risk, especially if earnings decline. However, acceptable ratios vary by industry:
- Technology: 15%-30% (due to growth focus).
- Utilities: 50%-75% (steady cash flow supports higher payouts).
- REITs: 90%+ (required by law to distribute taxable income).
High ratios can be acceptable in specific cases, like temporary earnings dips or sector norms. Always consider other factors like cash flow, debt levels, and revenue trends when assessing dividend sustainability.
Safe Dividend Payout Ratios by Industry and Warning Signs
Payout Ratio Explained: How to Pick Safe Dividend Stocks
sbb-itb-484be5d
What Makes a Dividend Payout Ratio Safe?
Understanding what constitutes a safe dividend payout ratio is essential for evaluating whether a company can sustain its dividend payments over time. A "safe" ratio largely depends on a company’s ability to maintain payouts during periods of fluctuating earnings or economic downturns. While there’s no universal number that applies to all businesses, general benchmarks and industry-specific norms can provide helpful guidance.
Standard Safe Range: 30–60%
For many well-established companies, a dividend payout ratio between 30% and 60% is often seen as sustainable. This range strikes a balance: it allows companies to reward shareholders while still retaining enough capital for reinvestment, paying down debt, or addressing unexpected challenges. For instance, Microsoft reported a payout ratio of 41.5% in 2012, a level that supported its ability to maintain dividends without overextending its financial resources.
How Safe Ratios Vary by Industry
The definition of a "safe" payout ratio can vary widely depending on the industry. Companies in defensive sectors like utilities, telecommunications, and consumer staples, which enjoy steady and predictable cash flows, can often manage higher payout ratios – typically in the 50% to 75% range. On the other hand, businesses in growth-focused sectors, such as technology and biotech, usually keep their payout ratios lower, often between 15% and 30%, to prioritize reinvestment in research, development, and expansion.
Real Estate Investment Trusts (REITs) are a unique case. By law, REITs must distribute at least 90% of their taxable income to shareholders, but they rely on funds from operations rather than net income to do so. This makes their payout ratios appear much higher compared to other industries.
| Industry/Sector | Typical Safe Payout Ratio Range | Reasoning |
|---|---|---|
| Technology / Growth | 15% – 30% | High reinvestment needs for expansion |
| Stable/Mature Industries | 30% – 60% | Balances shareholder payouts with reinvestment needs |
| Utilities / Defensive | 50% – 75% | Stable, predictable cash flows support higher ratios |
| REITs | 90%+ (of taxable income) | Legal requirement for high distributions |
These benchmarks can act as warning signs for investors when payout ratios exceed what is typical for a given industry.
Warning Signs: When Payout Ratios Are Too High
A payout ratio exceeding 80% often signals potential trouble. If a company’s ratio surpasses 100%, it is paying out more in dividends than it earns, which is a clear red flag for long-term sustainability. A striking example comes from 2008, when The Dow Chemical Co. maintained a payout ratio of 271%, distributing $1.68 per share despite earning only $0.62 per share. This unsustainable practice, combined with the financial strain of a $15.4 billion acquisition of Rohm and Haas, forced the company to slash its dividend to $0.60 per share in 2009.
Ayako Yoshioka, Senior Portfolio Manager at Wealth Enhancement Group, explains the risks of overly high payout ratios:
"A high dividend payout ratio becomes problematic because it implies that a significant portion of net income is being paid out to the shareholder and not retained for reinvestment back into the business."
Additionally, a steadily rising payout ratio over multiple quarters can be a red flag. This trend may indicate that a company’s earnings are shrinking while it struggles to maintain its dividend, which could lead to financial strain down the line.
Other Factors That Affect Dividend Safety
When assessing dividend safety, the payout ratio is just one piece of the puzzle. Factors like cash flow, debt levels, and revenue trends also play a critical role in determining whether a company can sustain its dividends over the long term. Let’s explore how these elements contribute to dividend reliability.
Cash Flow Stability
Dividends are paid in cash, not merely based on reported profits. A company might show impressive net income on paper, but without sufficient liquid cash, maintaining dividends becomes challenging. This is where free cash flow to equity (FCFE) comes in – it measures the cash left for shareholders after covering expenses, reinvestments, and debt obligations.
Harry C., an AAII member, explains: "This ratio [free-cash flow payout ratio] is more accurate because, in reality, companies pay dividends from free cash flow, not earnings".
If cash flow falls short, companies may resort to borrowing or dipping into reserves to fund dividends – neither of which is sustainable over time.
For example, Texas Instruments (TXN) uses a free-cash-flow payout ratio target of 40% to 60%, offering investors a clearer view of dividend safety compared to earnings-based metrics. Similarly, International Paper Co. (IP) targets a free-cash-flow payout ratio of 40% to 50%. During 2020, its earnings payout ratio soared to 167.3% due to pandemic-related disruptions, but analysts pointed to a projected recovery in 2021, with a payout ratio of 53.5%, to confirm the dividend’s sustainability.
Debt Levels and Economic Downturns
High debt can jeopardize dividend payments, especially during tough economic times. When debt levels rise, companies must prioritize interest payments, leaving less cash for dividends. The Net Debt to EBITDA ratio is a helpful metric here – it shows how many years it would take for a company to repay its debt. A rising ratio over time often signals potential trouble for dividend payouts.
Todd Lowenstein, Chief Equity Strategist at HighMark Capital Management, notes: "Companies which pay predictable dividends generally have stable business models that throw off large amounts of excess cash beyond the needs of the underlying business".
Companies lacking this financial stability are more vulnerable during recessions.
Take Intel Corp. (INTC) as an example. In early 2023, the company reduced its dividend to free up $4 billion in annual liquidity, responding to declining revenue. Intel chose to prioritize reinvestment over maintaining dividends, highlighting the tough decisions companies sometimes face when debt and revenue pressures mount.
Revenue Growth and Business Stability
Consistent revenue growth is another critical factor for sustaining and increasing dividends. Companies with stable business models – especially those in sectors like utilities and consumer staples – often enjoy predictable cash flows that allow for higher payout ratios, even during economic downturns.
Between 1973 and 2022, companies that grew or initiated dividends achieved average annual returns of 10.24%, compared to just 3.95% for companies that cut or eliminated dividends. This performance gap underscores the importance of examining revenue trends alongside payout ratios.
Cyclical businesses, such as airlines and energy companies, face greater risks because their earnings fluctuate with economic cycles. For these companies, high payout ratios can be particularly precarious. Meanwhile, Apple (AAPL), as of October 2025, maintained a conservative dividend payout ratio of 15%, supported by annual earnings of $6.58 per share and an annual dividend of $0.96 per share. This low ratio, combined with robust cash flow and revenue growth, illustrates how strong financial fundamentals provide a cushion for dividend safety.
When High Payout Ratios Are Acceptable
High payout ratios aren’t always a red flag. In certain situations, they can be perfectly reasonable. Recognizing these exceptions can help you spot strong dividend opportunities that might otherwise go overlooked.
Let’s take a closer look at how temporary earnings disruptions and industry-specific factors can influence payout ratios.
Temporary Increases in Payout Ratios
Sometimes, earnings take a temporary hit due to one-off events, causing payout ratios to spike. This doesn’t necessarily mean the business is in trouble. For instance, one-time charges or external shocks can depress earnings, making the payout ratio look artificially high – even when the company’s fundamentals remain solid.
Take Hanesbrands in 2017 as an example. The company reported a staggering 353% payout ratio due to one-time charges tied to U.S. federal income tax reform and acquisition integration costs. However, when these were adjusted, the payout ratio fell back to its historical average of around 33%.
Bridget Weishaar, Senior Equity Analyst at Morningstar, noted: "Going forward, excluding one-time charges, we see the payout ratio averaging 33% over the next five years, which we view as reasonable".
Another example is 3M Co., which saw its payout ratio temporarily climb during an earnings dip. As earnings recovered, the ratio normalized. The critical question is whether analysts expect earnings to bounce back. If forward estimates show the payout ratio returning to a healthy range (typically 30-60%), a temporary spike is usually nothing to worry about.
Now, let’s shift focus to industries where higher payout ratios are the norm.
Industries That Use Different Metrics
In some sectors, traditional payout ratios don’t tell the whole story. For example, Real Estate Investment Trusts (REITs) are required to distribute at least 90% of their taxable income, making conventional payout ratios less relevant. Instead, metrics like Adjusted Funds From Operations (AFFO) or Distributable Cash Flow provide a clearer picture of their dividend-paying capacity.
Similarly, utilities and telecommunications companies often maintain higher payout ratios. Their predictable cash flows and mature business models allow them to sustain these levels. For income-focused investors, a payout ratio around 60% is often considered reasonable in these industries.
The takeaway? Context is everything. A 90% payout ratio might be manageable for a REIT or utility company but could spell trouble for a cyclical manufacturer. Always compare payout ratios to industry peers and rely on the right metrics for the sector you’re analyzing.
How to Evaluate Dividend Sustainability
Determining whether a company can sustain its dividend payments isn’t as simple as looking at a single number. It requires a broader analysis of trends, industry benchmarks, and key financial indicators.
Review Historical Payout Ratio Trends
Looking at a company’s payout ratio over time can reveal patterns of stability or potential risks. A consistent ratio across multiple years often signals a well-managed company with a reliable dividend history. On the other hand, a sudden spike in the ratio might indicate trouble brewing beneath the surface. For example, a rising payout ratio could reflect a maturing business, but it could also be a warning sign if earnings growth isn’t keeping pace with dividend increases.
Earnings volatility is another factor to watch closely. Companies with inconsistent earnings often show erratic payout ratios, which can make dividends less predictable. Instead of relying solely on trailing twelve-month (TTM) data, it’s useful to calculate a forward payout ratio based on estimated future earnings. This approach helps assess whether upcoming changes might jeopardize the dividend.
Take Microsoft Corp. (MSFT) as an example. Between 2006 and 2012, the company maintained a median payout ratio of 29.9%, while its dividends per share more than doubled. This steady ratio, coupled with growing dividends, highlights a strong foundation for dividend sustainability. Such historical context is invaluable when comparing a company to its industry peers or diving deeper into its financial health.
Compare Against Industry Peers
A payout ratio that seems high in one sector might be perfectly normal in another. That’s why it’s essential to compare a company’s ratio to the median for its specific industry rather than broader market averages. This comparison helps determine whether the ratio is a sign of financial stability or a potential red flag.
For instance, in 2012, Microsoft reported a payout ratio of 41.5%. While this was above the industry median, it reflected the company’s maturity and its ability to balance dividend payments with reinvestment. Evaluating the ratio within the context of its industry provides a clearer picture of what’s sustainable and what might be cause for concern.
Track Key Financial Health Metrics
While the payout ratio is an important indicator, it doesn’t tell the whole story. Other financial metrics can offer deeper insights into a company’s ability to maintain its dividends.
- Free Cash Flow (FCF) Payout Ratio: This metric, calculated by dividing total dividends paid by free cash flow, shows how much actual cash is available after covering capital expenditures. It’s often more reliable than earnings-based ratios.
- Net Debt to EBITDA: This ratio measures leverage. A rising or high ratio could signal that a company is taking on too much debt, potentially putting dividends at risk.
- Dividend Coverage Ratio: By dividing annual earnings per share (EPS) by annual dividends per share (DPS), this metric indicates how many times a company can cover its dividend payments with its earnings. A higher ratio provides a stronger safety margin.
Consider the case of Transocean (RIG) as a warning. In January 2015, the company paid an annual dividend of $3.00. While its 2014 earnings of $4.78 suggested a safe payout ratio of around 63%, projected 2015 earnings of just $2.40 pushed the forward payout ratio to an alarming 125%. This shift clearly signaled that the dividend was unsustainable.
Final Thoughts on Safe Dividend Payout Ratios
Grasping dividend payout ratios means looking at the bigger picture rather than sticking to a single benchmark. For most stable companies, a payout ratio between 30% and 50% is often deemed reasonable. But for firms in sectors like utilities – where cash flows are steady and predictable – ratios of 60% or higher are common. On the other hand, in the case of REITs, high payout ratios are the norm because they’re legally required to distribute at least 90% of their taxable income.
The red flag? When a company pays out more than 100% of its earnings. This approach is unsustainable and a clear sign that the dividend is at risk of being cut in the future.
However, it’s not enough to focus solely on the earnings-based payout ratio. Since dividends are paid from cash, the free cash flow payout ratio offers a more reliable measure of sustainability. Pair this with metrics like Net Debt to EBITDA and historical trends, and you’ll get a clearer picture of a company’s ability to maintain its dividends. Many companies rely on these combined metrics to evaluate and communicate the stability of their payouts to investors.
Another critical factor? The consistency of dividend payments. Companies with a history of maintaining or increasing their dividends – like the Dividend Aristocrats – are often seen as safer bets. For example, in 2020, during a year of major economic upheaval, only 7% of U.S. companies in the Janus Henderson Global Dividend Index reduced or canceled their dividends. That kind of reliability speaks volumes about a company’s commitment to its shareholders.
FAQs
How does a company’s industry impact a safe dividend payout ratio?
The industry a company belongs to plays a big role in determining what qualifies as a safe dividend payout ratio. Businesses in steady, high-cash-flow sectors – like utilities, consumer staples, and telecommunications – often support higher payout ratios, typically ranging from 60% to 80% or more. This is because their earnings are consistent and predictable. In contrast, companies in cyclical or capital-intensive industries – such as airlines, energy, and mining – deal with fluctuating earnings and hefty capital requirements. For them, lower payout ratios, usually below 50%, are considered safer.
For investors, aligning expectations with the industry is crucial. A 70% payout ratio might be perfectly reasonable for a utility company, but the same figure for a tech or airline business could raise red flags. Understanding the cash flow stability of an industry can help assess whether a dividend is dependable or just a temporary result of short-term earnings growth.
What are the potential risks of a high dividend payout ratio?
A high dividend payout ratio might raise red flags about a company’s financial stability. It can suggest that the company is focusing more on paying dividends than on reinvesting in its own growth or keeping enough financial flexibility. This approach could leave the company vulnerable during economic slumps or when unexpected costs arise.
On top of that, companies with elevated payout ratios are at greater risk of cutting or even suspending dividends if their earnings take a hit. This can trigger stock price swings and shake investor confidence. For those who rely on dividend income, it’s crucial to assess whether the payout ratio reflects the company’s overall financial health and its ability to sustain payouts over the long haul.
What is the best way to evaluate if a company’s dividends are sustainable?
To assess whether a company’s dividends are likely to hold steady, start by examining its dividend payout ratio. This ratio is calculated by dividing the annual dividends by the annual earnings per share (EPS). Generally, a payout ratio under 60-70% is seen as a safer zone, providing some cushion for unexpected costs or fluctuations in earnings. On the other hand, if the ratio is nearing or surpassing 100%, it might indicate trouble sustaining those dividend payments.
Beyond the payout ratio, take a close look at the company’s cash flow consistency, debt levels, and whether it operates in a stable industry with predictable earnings. These elements are critical for ensuring that the company can keep paying dividends over time, even when the economy faces challenges.


