

Best Dividend ETFs for 2026: Complete Analysis and Rankings
Dividend ETFs are a popular choice for investors seeking regular income and reduced risk through diversification. This guide ranks the 7 best dividend ETFs for 2026, based on factors like yield, performance, expense ratios, and sector allocation. Here’s a quick summary:
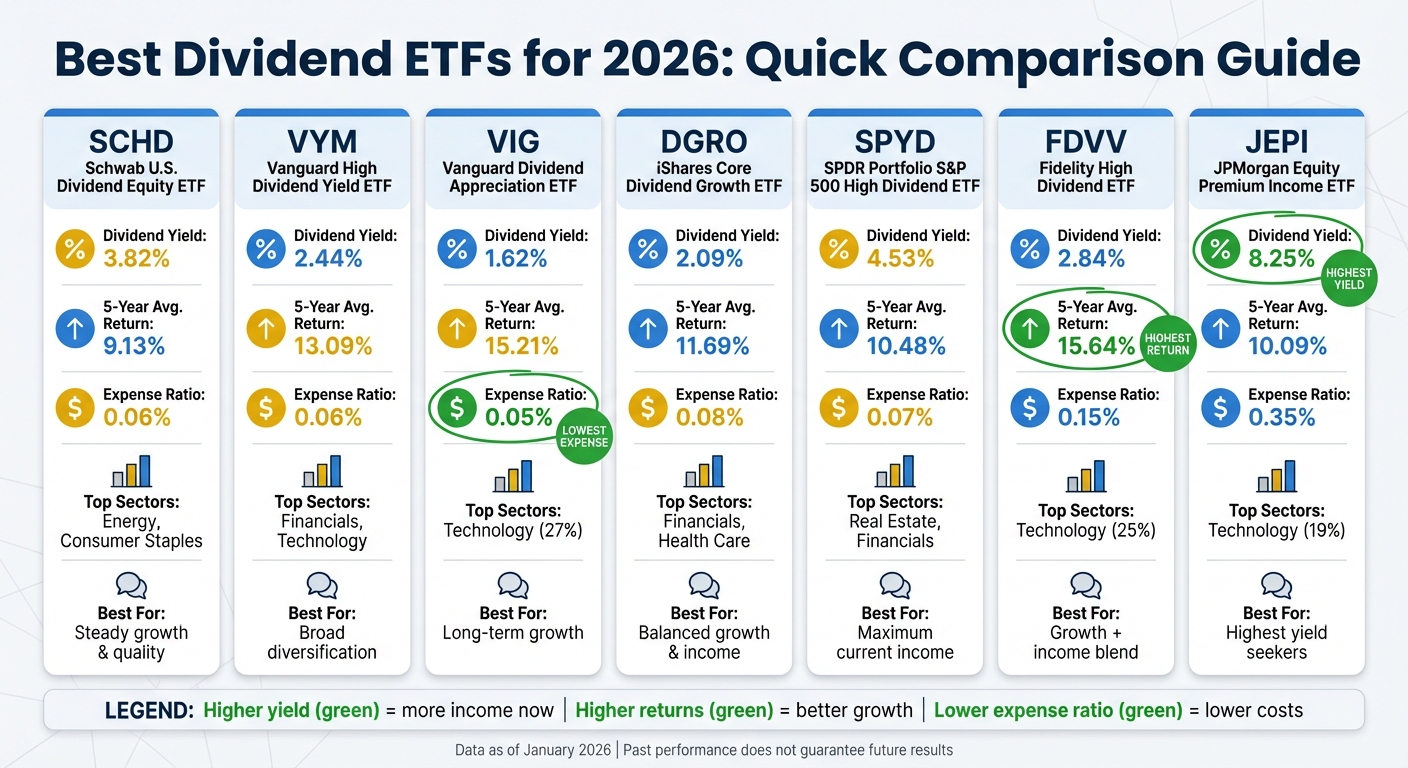
- SCHD: Yield of 3.82%, focuses on blue-chip stocks with steady growth. Low expense ratio (0.06%).
- VYM: Yield of 2.44%, broader diversification, strong 5-year returns of 13.09%.
- VIG: Yield of 1.62%, prioritizes consistent dividend growth, tech-heavy (27%).
- DGRO: Yield of 2.09%, blends high yield and dividend growth, steady 5-year returns of 11.69%.
- SPYD: Yield of 4.53%, focuses on high-yield S&P 500 stocks, lower growth potential.
- FDVV: Yield of 2.84%, combines income with tech-driven growth, highest 5-year return (15.64%).
- JEPI: Yield of 8.25%, uses call options for high income, lower growth during bull markets.
Quick Comparison
| ETF | Dividend Yield | 5-Year Avg. Return | Expense Ratio | Top Sector |
|---|---|---|---|---|
| SCHD | 3.82% | 9.13% | 0.06% | Energy, Consumer Staples |
| VYM | 2.44% | 13.09% | 0.06% | Financials, Technology |
| VIG | 1.62% | 15.21% | 0.05% | Technology (27%) |
| DGRO | 2.09% | 11.69% | 0.08% | Financials, Health Care |
| SPYD | 4.53% | 10.48% | 0.07% | Real Estate, Financials |
| FDVV | 2.84% | 15.64% | 0.15% | Technology (25%) |
| JEPI | 8.25% | 10.09% | 0.35% | Technology (19%) |
Each fund has unique strengths. For steady growth, SCHD and VIG stand out. For high income, SPYD and JEPI are strong options. FDVV offers a mix of growth and income, while VYM and DGRO balance yield with diversification. Choose based on your goals – income now, long-term growth, or balanced returns.
Best Dividend ETFs 2026: Yield, Returns, and Expense Ratio Comparison
How To Build The Ultimate ETF Portfolio In 2026 (10 Best ETFs)
1. Schwab U.S. Dividend Equity ETF (SCHD)
SCHD focuses on blue-chip companies known for their financial strength, solid profitability, and consistent dividend payouts. The fund tracks the Dow Jones U.S. Dividend 100 Index and, as of January 16, 2026, manages approximately $75.7 billion in assets. It’s built for investors who value steady dividend growth over chasing high yields. Let’s take a closer look at its performance and structure.
"If you want to buy a basket of blue-chip dividend-paying companies, this ETF could be just what you’re looking for." – Rachel Warren, Contributor, The Motley Fool
Dividend Yield
SCHD currently offers a 3.82% yield (as of January 2026), placing it in the middle tier of dividend ETFs. Over the past five years, it has delivered an average annual dividend growth rate of 9.15%. As of January 15, 2026, the 30-day SEC yield stands at 3.64%. These figures highlight the fund’s ability to generate consistent income, setting the stage for its long-term performance.
5-Year Performance
From January 1, 2021, to December 31, 2025, SCHD achieved an 8.89% annualized return. To put that into perspective, a $1,000 investment five years ago would now be worth $1,300. However, during this period, SCHD lagged behind competitors in technology exposure, with only 9.49% of its portfolio in tech compared to VIG’s 28.65%. Despite this, its cost structure remains a standout feature.
Expense Ratio
SCHD boasts an exceptionally low 0.06% expense ratio – meaning investors pay just $6 annually for every $10,000 invested. This low cost ensures that more of the fund’s income goes directly to shareholders. Additionally, its passive management style and a modest 28.51% portfolio turnover rate enhance its tax efficiency, making it attractive for long-term investors.
Sector Allocation
The fund leans heavily into defensive and value-oriented sectors. As of September 30, 2025, Energy leads the pack at 19.34%, followed by Consumer Staples at 18.50%, Healthcare at 16.10%, and Industrials at 12.28%. Its top holdings include Lockheed Martin Corp (4.59%), Bristol Myers Squibb (4.22%), Chevron Corp (4.17%), Merck & Co Inc (4.12%), and ConocoPhillips (4.10%). This sector allocation positions SCHD as a defensive choice, particularly appealing if the market shifts focus away from high-priced tech stocks in 2026.
2. Vanguard High Dividend Yield ETF (VYM)
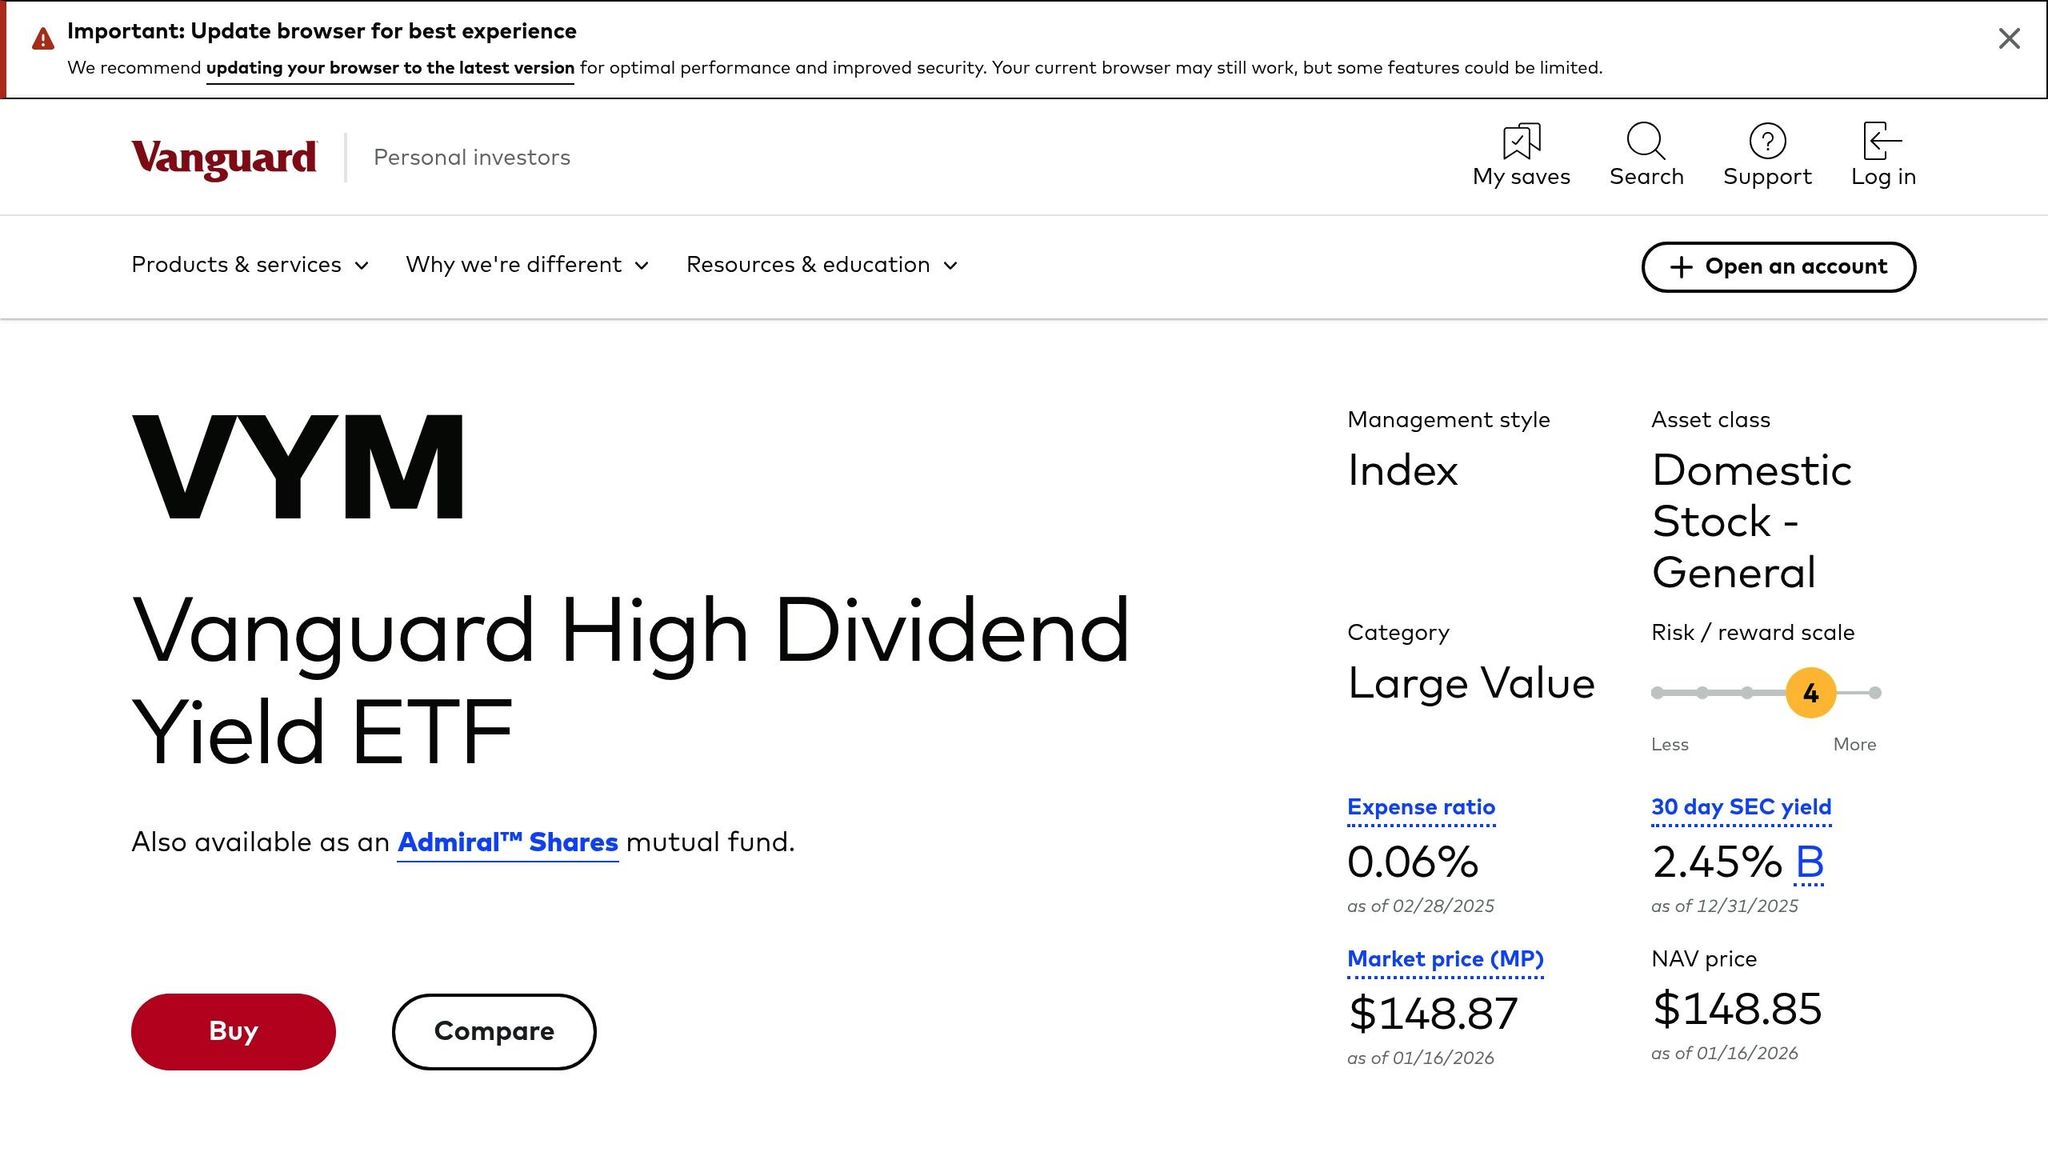
The Vanguard High Dividend Yield ETF (VYM) is designed to track the FTSE High Dividend Yield Index, emphasizing U.S. companies with above-average dividend yields while excluding REITs. As of December 31, 2025, VYM managed $84.6 billion in assets, spread across a diverse portfolio of 563 stocks. This broad exposure leans heavily toward large-cap value companies. Morningstar has praised the fund for its stable balance sheets and defensive positioning as of early 2026. Below, we break down VYM’s performance and portfolio features, highlighting why it appeals to income-focused investors in 2026.
Dividend Yield
As of January 8, 2026, VYM offered a dividend yield of 2.44%, with a 30-day SEC yield of 2.45%. While its yield is lower than SCHD’s 3.82%, VYM compensates with broader diversification and higher total returns. Broadcom, VYM’s largest holding, represents 7.57% of the portfolio.
5-Year Performance
Between January 1, 2021, and December 31, 2025, VYM achieved an annualized return of 13.09%, equating to a cumulative return of 81.57%. This performance surpasses SCHD’s 8.89% annualized return. VYM’s strong results stem partly from its increasing allocation to technology, including companies advancing in artificial intelligence. Despite this growth, the fund maintained lower volatility, with a 5-year beta of 0.76 and a maximum drawdown of -15.83%.
Expense Ratio
VYM stands out with an exceptionally low expense ratio of 0.06%, meaning investors pay just $6 for every $10,000 invested. Its portfolio turnover rate of 11.3% reflects its passive, full-replication strategy, which ensures tight alignment with the benchmark index and supports tax efficiency.
Sector Allocation
As of December 31, 2025, VYM’s largest sector allocation was Financials at 21.90%, followed by Technology (13.40%), Industrials (13.20%), and Health Care (12.90%). The fund’s top holdings included Broadcom Inc. (7.57%), JPMorgan Chase & Co. (4.15%), Exxon Mobil Corp. (2.41%), Johnson & Johnson (2.36%), and Walmart Inc. (2.30%). This balanced mix offers defensive stability while capturing growth opportunities, making VYM a versatile option for income-focused investors in 2026.
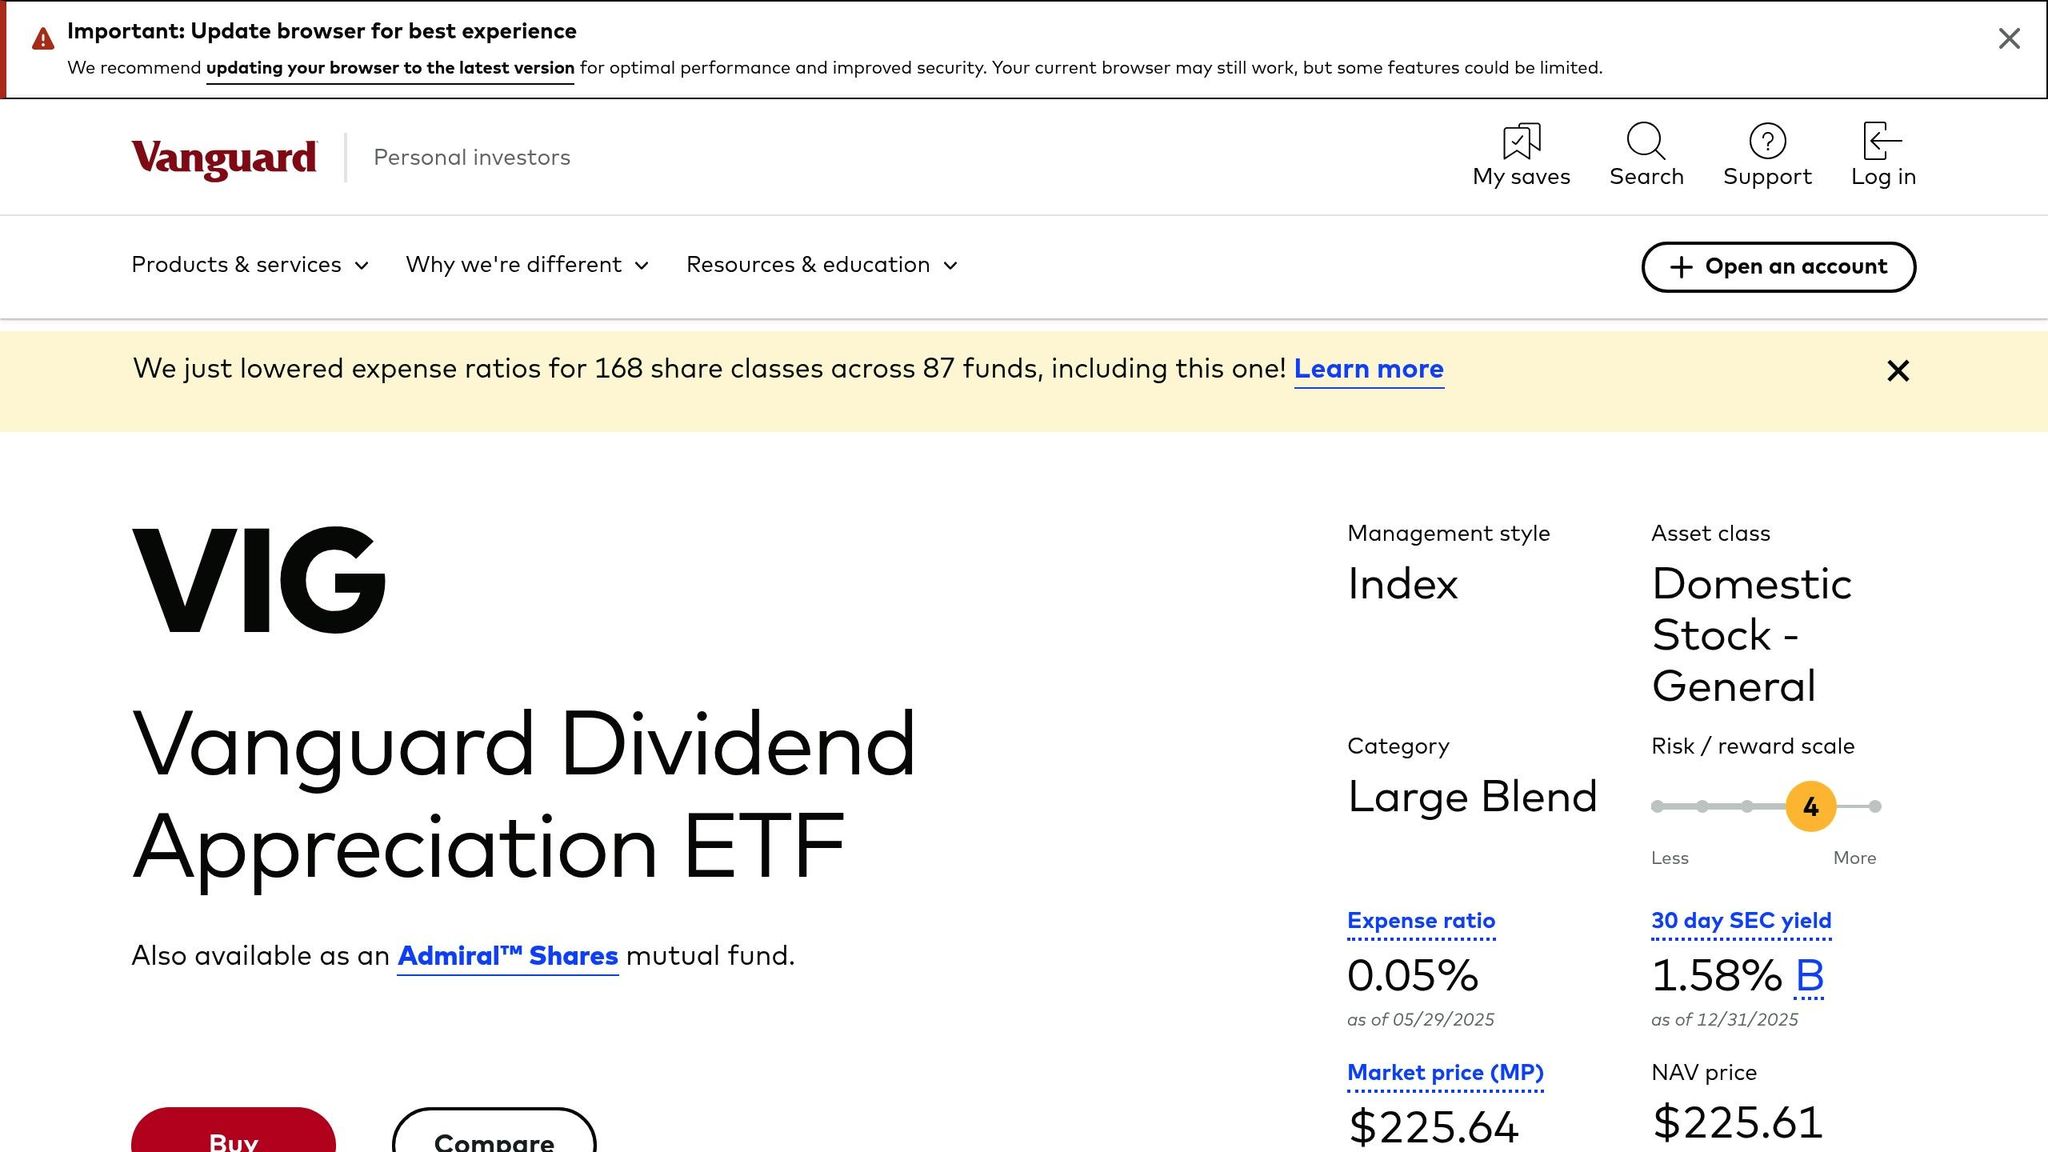
3. Vanguard Dividend Appreciation ETF (VIG)
The Vanguard Dividend Appreciation ETF (VIG) takes a unique approach by prioritizing consistent dividend growth over chasing high current yields. This fund tracks the S&P U.S. Dividend Growers Index, which focuses solely on companies that have increased their dividends for at least 10 consecutive years. As of December 31, 2025, VIG managed an impressive $120.1 billion across 338 stocks. Morningstar recognized its strength, awarding it a Gold rating on December 15, 2025. With its strategy, VIG complements other income-focused ETFs like SCHD and VYM, making it an excellent choice for investors looking to balance growth with income.
Dividend Yield
As of December 31, 2025, VIG delivered a dividend yield of 1.63%, supported by a 30-day SEC yield of 1.58%. Its focus on sustainable income growth is evident in its five-year average annual dividend increase of 9.15%. By avoiding the highest-yielding stocks, VIG steers clear of potential value traps, ensuring a more stable and reliable growth trajectory.
5-Year Performance
From January 1, 2021, to December 31, 2025, VIG posted an annualized return of 15.21%, translating to a cumulative return of 70.57%. This performance not only outpaced SCHD’s cumulative return of 57.8% but also beat the broader market. A significant contributor to this success is the fund’s 27.0% allocation to Information Technology, including major holdings like Broadcom Inc. (6.66%), Microsoft Corp. (4.41%), and Apple Inc. (4.15%). VIG’s cost efficiency further solidifies its competitive advantage.
Expense Ratio
VIG boasts a rock-bottom expense ratio of just 0.05%, making it one of the most affordable dividend ETFs available. This is a stark contrast to the 0.73% average expense ratio for similar funds in the Large Blend category. Additionally, its portfolio turnover rate of 11.1% reflects a passive, full-replication strategy that keeps trading costs low and improves tax efficiency.
"this strategy’s low expense ratios further carve out a durable edge"
Bryan Armour, Director at Morningstar, highlighted this cost advantage as a key benefit for long-term investors.
Sector Allocation
As of December 31, 2025, Information Technology led VIG’s sector allocation at 27.0%, followed by Financials at 22.3%, Health Care at 16.7%, and Industrials at 10.9%. This heavy emphasis on tech sets VIG apart from more traditional dividend ETFs, allowing it to capitalize on the recent gains driven by advancements in AI. The fund’s top five holdings – Broadcom Inc. (6.66%), Microsoft Corp. (4.41%), Apple Inc. (4.15%), JPMorgan Chase & Co. (4.06%), and Eli Lilly & Co. (3.92%) – combine growth-focused tech giants with reliable dividend payers, making VIG a standout choice for growth-oriented income investors.
4. iShares Core Dividend Growth ETF (DGRO)
The iShares Core Dividend Growth ETF (DGRO) offers a blend of high-yield dividends and consistent dividend growth. It follows the Morningstar US Dividend Growth Index, which focuses on U.S. companies with a proven track record of increasing dividends. As of January 16, 2026, DGRO managed an impressive $37.16 billion across 396 stocks and received a Gold rating from Morningstar on November 30, 2025. This combination of strategy and cost efficiency makes it a strong contender in the ETF market.
Dividend Yield
As of December 31, 2025, DGRO provided a dividend yield of 2.09% and a 30-day SEC yield of 2.14%. This yield places it between ETFs like VIG (1.62%) and SCHD (3.82%). Over the years, DGRO’s annual dividend payout has grown steadily, increasing from $0.66 in 2016 to $1.45 in 2025, reflecting reliable income growth. With a one-year growth rate of 4.73% and a payout ratio of 44.03%, DGRO demonstrates strong potential for continued dividend increases.
5-Year Performance
Between January 1, 2021, and December 31, 2025, DGRO delivered an annualized return of 11.69%, resulting in a cumulative return of 73.81%. While the fund experienced a dip of 7.85% in 2022, it rebounded strongly with returns of 16.61% in 2024 and 15.74% in 2025. This performance highlights the resilience of dividend-growing companies, which often fare better during economic downturns.
Expense Ratio
DGRO’s expense ratio is a low 0.08%, making it one of the most cost-effective options available. This efficiency has earned it an "Excellent" rating for costs from U.S. News & World Report, emphasizing the importance of keeping fees low to maximize investor returns.
Sector Allocation
As of January 16, 2026, DGRO maintains a diversified portfolio: Financials account for 20.32%, Health Care for 17.00%, and Information Technology for 16.01%. Its top holdings include Exxon Mobil Corp (3.15%), Johnson & Johnson (3.05%), JPMorgan Chase & Co (2.77%), Microsoft Corp (2.69%), and Apple Inc (2.62%), offering broad exposure across Energy, Health Care, Financials, and Technology sectors.
sbb-itb-484be5d
5. SPDR Portfolio S&P 500 High Dividend ETF (SPYD)
The SPDR Portfolio S&P 500 High Dividend ETF (SPYD) is designed to follow the S&P 500 High Dividend Index, which identifies the 80 highest-yielding stocks within the S&P 500 and assigns them equal weight. As of January 15, 2026, the fund managed $7.51 billion in assets spread across 78 holdings. This strategy, often referred to as "yield-chasing", emphasizes generating immediate income, making it appealing to investors seeking regular cash flow.
Dividend Yield
SPYD stands out for its focus on delivering high dividend yields. As of January 15, 2026, the ETF offered a 30-Day SEC Yield of 4.53% and a Fund Distribution Yield of 4.34%. These figures surpass the yields of competitors like SCHD (3.82%) and DGRO (2.03%), making SPYD a strong option for income-oriented investors. However, a key consideration is the tax treatment of these dividends. Due to its significant allocation to Real Estate Investment Trusts (REITs), a large portion of SPYD’s dividends is taxed as ordinary income rather than qualified dividends. Additionally, the fund’s semi-annual rebalancing resulted in a portfolio turnover rate of nearly 67% in 2025, which could introduce further tax implications.
5-Year Performance
From January 1, 2021, to December 31, 2025, SPYD achieved an annualized return of 10.48%. While this performance is solid, it falls short of the broader market, reflecting the balance between prioritizing high income and potential capital growth. The fund’s one-year return stood at 4.67% as of December 31, 2025, improving to 8.86% by January 15, 2026. SPYD’s returns are closely linked to interest rate movements. Rising rates often create challenges for high-yield stocks, as investors may pivot toward bonds.
Expense Ratio
One of SPYD’s standout features is its low expense ratio of 0.07%. This cost efficiency has earned it recognition, including an "Excellent" rating for expenses from U.S. News & World Report. The low fees help investors retain more of the fund’s generous dividend income.
Sector Allocation
SPYD’s portfolio, as of January 15, 2026, reflects its focus on high-yield sectors. Real Estate leads the way, accounting for 21.34% of the fund, followed by Financials (17.08%), Consumer Staples (16.23%), and Utilities (13.32%). Meanwhile, Information Technology represents a mere 1.00% of the portfolio. The fund’s top holdings include CVS Health Corp (1.72%), Viatris Inc (1.71%), Invesco Ltd (1.71%), APA Corp (1.68%), and Merck & Co. Inc. (1.64%). By equally weighting its holdings, SPYD reduces concentration risk, though this approach may also include companies facing operational or financial challenges.
6. Fidelity High Dividend ETF (FDVV)
The Fidelity High Dividend ETF (FDVV) follows the Fidelity High Dividend Index, focusing on large and mid-cap companies with steady dividend growth. As of January 13, 2026, 25.22% of its holdings are in the Technology sector. This tech-heavy approach allows the fund to benefit from the growth of leading technology and semiconductor companies while maintaining a steady income stream. With $8.25 billion in total net assets, FDVV has earned a Morningstar Medalist Rating of Silver or Gold as of late 2025. Let’s explore some of its key metrics.
Dividend Yield
FDVV combines a growth-oriented strategy with consistent dividends, offering a dividend yield of 2.84% as of January 16, 2026. The fund distributes a quarterly dividend of approximately $0.39 per share. Its top holdings include NVIDIA (6.57%), Apple (5.78%), Microsoft (5.16%), and Broadcom (2.97%), reflecting its strong emphasis on the tech sector as of December 31, 2025.
5-Year Performance
FDVV has shown solid performance by balancing income generation with capital growth. From January 1, 2021, to January 16, 2026, it achieved an average annual return of 15.64%, outperforming the Large Value category average of 11.70%. Annual returns during this period included 29.32% in 2021, –4.11% in 2022, 17.90% in 2023, 21.71% in 2024, and 17.20% in 2025. Its one-year return as of January 16, 2026, was 17.81%. Morningstar analyst Brendan McCann noted that FDVV “rides the line between income and price appreciation” and offers a higher dividend yield than most funds in its category without compromising growth potential.
Expense Ratio
FDVV has an expense ratio of 0.15%, which has earned it an "Excellent" cost rating from U.S. News. While slightly higher than SCHD’s and VYM’s 0.06%, it remains competitive and reasonable for its performance.
Sector Allocation
FDVV’s sector allocation reflects its strategy of blending growth with income. As of January 13, 2026, Technology leads with 25.22%, followed by Financial Services (19.76%), Consumer Defensive (11.85%), Real Estate (11.24%), Utilities (9.45%), and Energy (9.05%). This strong focus on technology sets it apart from traditional high-yield funds, which often lean toward more defensive sectors. The fund’s price of $57.72 as of January 16, 2026, is near its 52-week high of $57.78.
7. JPMorgan Equity Premium Income ETF (JEPI)
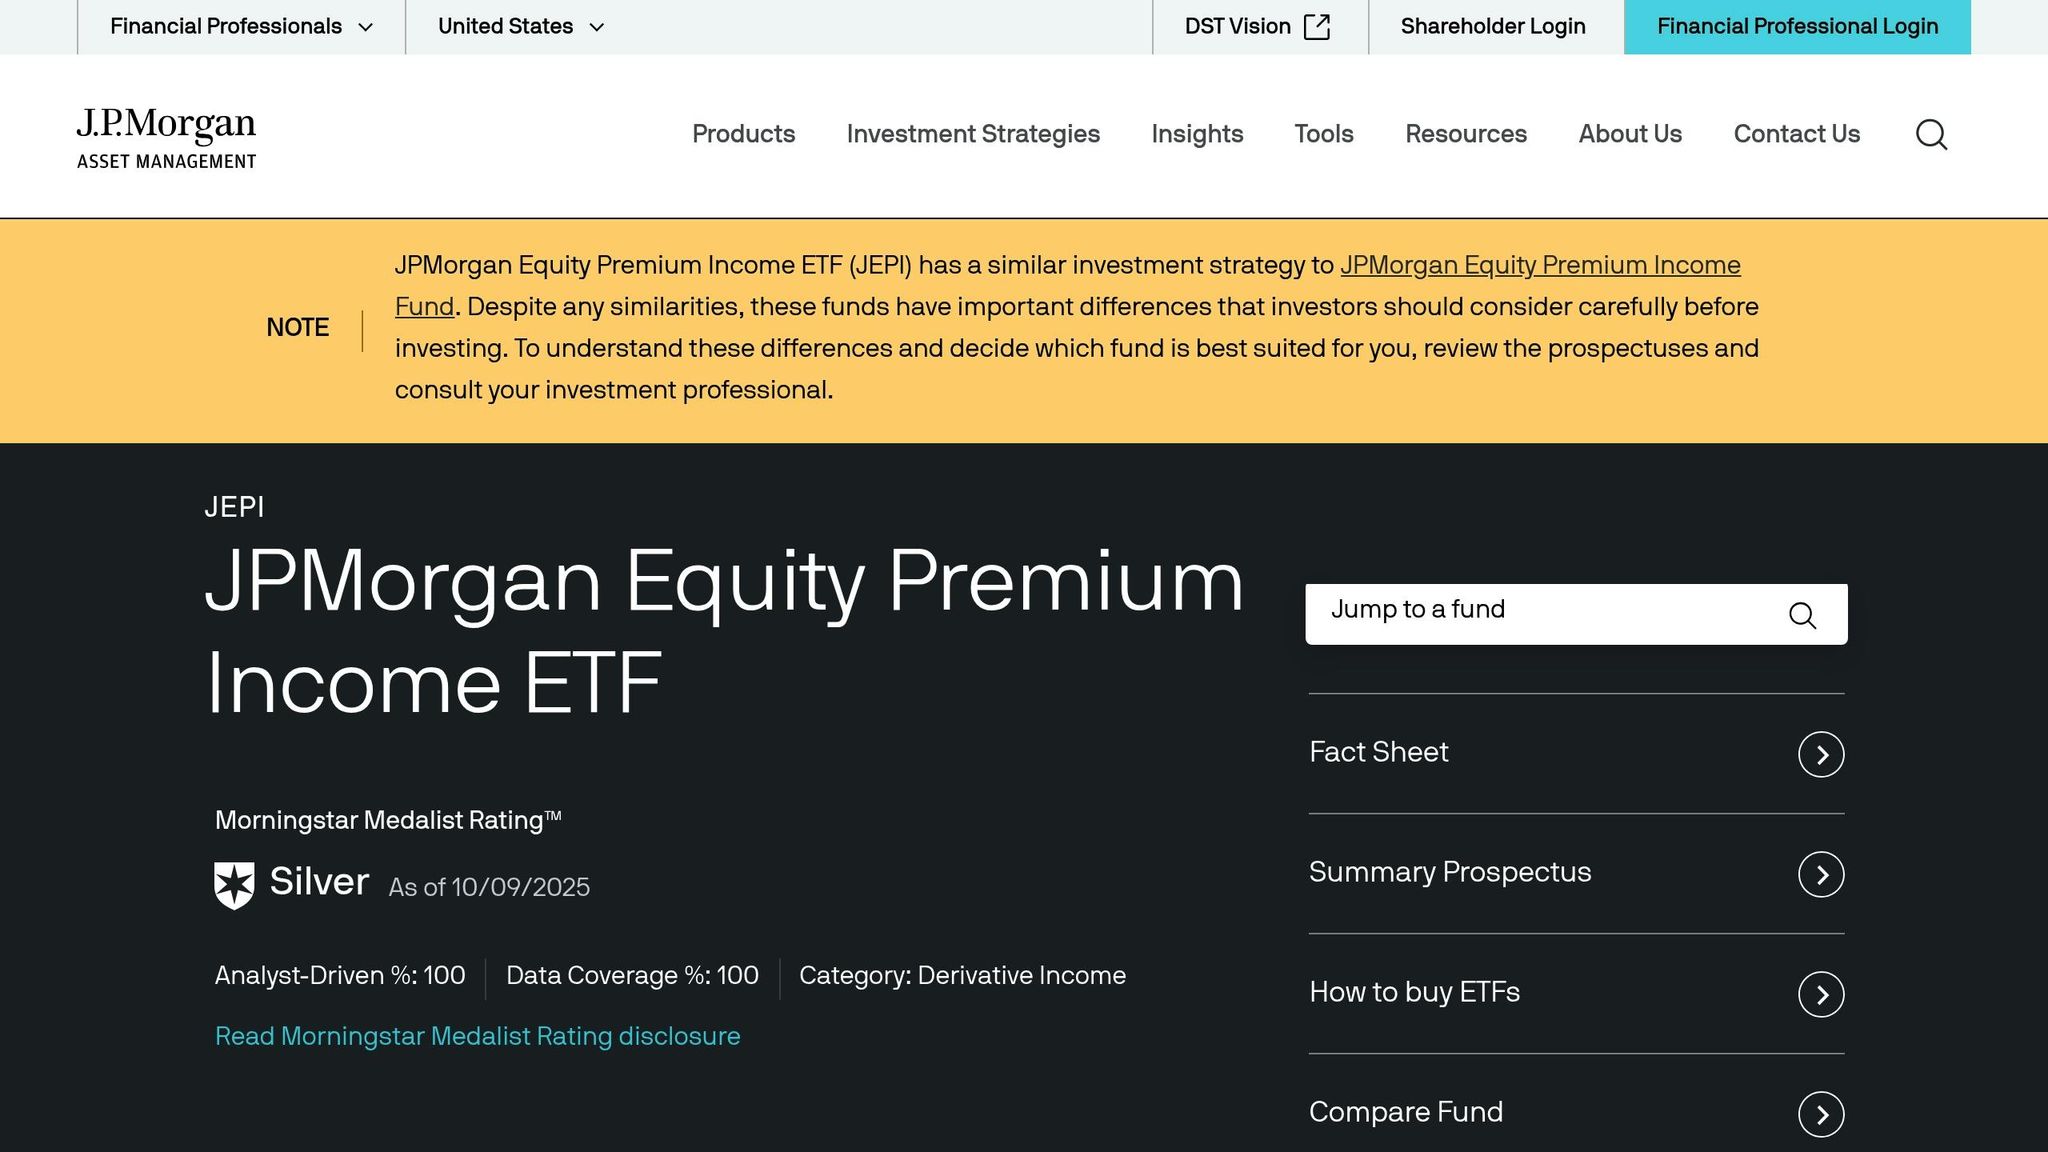
The JPMorgan Equity Premium Income ETF (JEPI) takes a different path compared to traditional dividend ETFs. This actively managed fund blends a portfolio of low-volatility S&P 500 stocks with equity-linked notes (ELNs) that generate income by selling call options. As of January 2026, JEPI manages $41.49 billion in net assets, focusing on delivering high yields and minimizing volatility for income-oriented investors. With a beta of 0.52, the fund’s volatility is significantly lower than the broader market. Below is a closer look at JEPI’s performance, costs, and portfolio breakdown.
Dividend Yield
JEPI boasts a dividend yield of 8.25% as of January 16, 2026, which is well above the yields offered by many other dividend ETFs. This impressive yield is primarily driven by the premiums from its options strategy. The fund’s top holdings include Alphabet Inc. Class A (1.67%), Johnson & Johnson (1.65%), AbbVie Inc. (1.63%), and Amazon.com Inc. (1.55%), based on data from late 2025. During the 2022 bear market, JEPI demonstrated resilience, declining only 9%, compared to the S&P 500’s 18% drop.
5-Year Performance
From January 1, 2021, to January 16, 2026, JEPI delivered an average annual return of 10.09%. In 2024, the fund returned 12.56%, while in 2023, it achieved 15%, though its capped call strategy limited gains during the S&P 500’s 27% rally that year. Since its inception in May 2020, JEPI has achieved an average annual return of 12.41%. The fund’s reliance on sold call options means that while it can generate consistent income, its returns are capped during strong bull markets.
Expense Ratio
JEPI’s expense ratio stands at 0.35%, reflecting the costs associated with its active management and options strategy. As of January 16, 2026, the fund’s net asset value (NAV) was $58.38, and it traded within a 52-week range of $49.94 to $59.73.
Sector Allocation
As of January 18, 2026, JEPI’s sector allocation is as follows: Technology (19.30%), Healthcare (14.71%), Financial Services (13.13%), Industrials (12.97%), Consumer Cyclical (12.26%), Consumer Defensive (7.59%), Communication Services (7.08%), Utilities (5.37%), Real Estate (3.27%), Energy (2.16%), and Basic Materials (2.15%). This diversified sector mix helps balance its defensive stance while maintaining exposure to growth-oriented areas.
Comparison of Dividend ETFs
Let’s break down the key differences among these dividend ETFs to help you find the one that best suits your investment strategy. The seven funds fall into two categories: high-yield options like SPYD and SCHD, and dividend growth-focused funds like VIG and DGRO, which offer lower yields but greater potential for capital appreciation over time. For example, over five years, the tech-heavy VIG delivered a return of 75.1%, outpacing SCHD’s 57.8%, even though both achieved an annual dividend growth rate of 9.15%.
When it comes to expense ratios, these ETFs are among the most cost-efficient, with annual fees ranging from 0.05% to 0.08% for most funds. One notable exception is JEPI, which has a higher expense ratio of 0.35%.
Performance-wise, FDVV leads the pack with a 5-year average annual return of 15.34%, while SPYD takes the top spot for dividend yield at 4.53%. On the other hand, VIG’s 28% allocation to technology allowed it to benefit significantly from the recent surge in AI-related stocks, whereas SCHD’s more modest 9.5% tech exposure limited its performance by comparison.
| ETF | Dividend Yield | 5-Year Avg. Annual Return | Expense Ratio | Top Sector Allocation |
|---|---|---|---|---|
| SCHD | 3.82% | 9.13% | 0.06% | Energy, Consumer Defensive |
| VYM | 2.44% | 12.51% | 0.06% | Financials, Energy |
| VIG | 1.62% | 11.37% | 0.05% | Technology (28%) |
| DGRO | 2.09% | 11.67% | 0.08% | Dividend Growth Focus |
| SPYD | 4.53% | 10.37% | 0.07% | High Yield/S&P 500 |
| FDVV | 2.89% | 15.34% | 0.15% | High Dividend/Quality |
| JEPI | 8.25% | 10.09% | 0.35% | Technology (19.3%) |
This table highlights each fund’s strengths, providing clarity for aligning your choice with your financial goals.
But numbers only tell part of the story. It’s also important to think about how these funds fit into your broader portfolio. For instance, if you already hold significant S&P 500 or Nasdaq-100 exposure, you’ll want to watch for sector overlaps – especially with VIG, which has a heavy focus on tech giants like Apple, Microsoft, and Broadcom. Omor Ibne Ehsan of 24/7 Wall St. explains:
"VIG gives you all this tech exposure and yields 1.58% in dividends… Buying VIG increases your tech exposure".
For investors seeking to diversify away from technology, SCHD’s value-oriented approach might be a better fit. Its focus on financials, industrials, and defensive sectors aligns well with the current market trend of rotating into these areas.
Conclusion
After breaking down the performance and strategy of each ETF, here’s a quick guide to help you align the right fund with your investment approach.
Choosing a dividend ETF should depend on your financial goals and the specific advantages each fund offers. For those who prefer a conservative strategy with steady income, SCHD stands out with a 3.82% yield, backed by stringent quality criteria that prioritize companies with strong cash flows and consistent dividend growth. As Ian Salisbury from Barron’s observed:
"Schwab U.S. Dividend Equity has some strong points. It yields 3.8%, compared with 1.6% for the Vanguard fund… and its portfolio is arguably undervalued as a result of the market’s obsession with growth".
On the other hand, VYM provides broad, low-cost exposure to large-cap dividend-paying stocks, appealing to investors looking for a balance of stability and simplicity.
If you’re focused on long-term growth, ETFs like VIG and DGRO might be a better fit, despite their lower yields of 1.62% and 2.09%, respectively. For example, VIG has delivered a 10-year average annual return of 13.85%, showcasing its potential for capital appreciation. However, keep in mind its 28% allocation to technology, which could lead to overlap if you’re already invested in the S&P 500.
For retirees seeking reliable income, SCHD and VYM are strong candidates, offering consistent payouts from well-established companies. Meanwhile, if you’re aiming for maximum yield, SPYD delivers a 4.53% yield, though it may come with slower growth potential. Be cautious about relying on high-yield covered-call ETFs like JEPI as the cornerstone of a conservative portfolio due to their higher risks.
Market conditions also play a role in decision-making. For instance, SCHD – trading at 14 times forward earnings compared to VIG‘s 21 times – might provide better downside protection if the growth-stock rally cools off. As one analysis pointed out:
"In a market where growth is muted and income matters more, SCHD’s combination of yield + stability is attractive".
Ultimately, the key is to choose an ETF that aligns with your priorities, whether you’re focused on generating income now, building long-term growth, or finding a balance between the two.
FAQs
What should I look for when selecting a dividend ETF for my portfolio?
When picking a dividend ETF, start by examining the dividend yield and whether it’s sustainable. While a high yield might catch your eye, it’s crucial to ensure the companies in the ETF can consistently support those payouts. Look for funds with a track record of steady dividend growth and steer clear of those that invest heavily in companies with high payout ratios, as these could be less dependable in the long run.
Another key factor is the expense ratio. Even seemingly small fees can eat into your returns over time, so opt for funds with lower costs. You’ll also want to assess the ETF’s sector diversification and risk level. Funds concentrated in sectors like utilities or financials may carry higher risks, so a well-diversified ETF is generally a safer bet.
Don’t forget to review the fund size and liquidity. Larger ETFs with high trading volumes typically offer smoother trading and narrower bid-ask spreads. If you’re investing through a taxable account, look for ETFs that hold qualified-dividend stocks, as they might offer better tax advantages. By weighing these factors carefully, you can choose a dividend ETF that fits your income needs and overall investment approach.
How do expense ratios affect the returns of dividend ETFs?
Expense ratios are the annual fees that funds charge to cover their management and operating costs, shown as a percentage of the fund’s total assets. These fees are taken directly from the fund’s assets, which means they reduce the returns investors ultimately receive. Even a small difference in expense ratios can have a noticeable effect on long-term returns. For instance, an ETF with an expense ratio of 0.05% lets investors retain more of the fund’s performance compared to one with a 0.30% expense ratio. Over time, this difference compounds, amplifying its impact.
When it comes to dividend ETFs – where yields often fall between 2% and 4% annually – keeping expenses low becomes even more critical. Higher expense ratios can eat into both dividend payouts and overall returns, including any growth in the fund’s price. To optimize returns over the long haul, it’s wise for investors to focus on low-cost ETFs that align with their income objectives and sector preferences. Lower fees can significantly contribute to building wealth over time.
Why would an investor choose a high-yield ETF like JEPI instead of a growth-focused ETF like VIG?
Investors might lean toward a high-yield ETF like JEPI if their primary goal is steady income. These funds are known for offering higher dividend payouts, making them especially attractive to income-focused individuals – retirees, for instance – who prioritize regular cash flow over building long-term wealth.
In contrast, a growth-focused ETF like VIG centers on dividend growth and capital appreciation. While this approach typically delivers lower immediate income, it offers greater potential for accumulating wealth over time. The decision boils down to what the investor values more: reliable income now or the opportunity for future growth.


