

10 Best Monthly Dividend Stocks for Reliable Cash Flow
Looking for reliable monthly income from your investments? Monthly dividend stocks are a great option. Unlike quarterly dividends, these stocks provide consistent cash flow every month, making them ideal for budgeting or reinvesting. This article highlights 10 top-performing monthly dividend stocks that offer yields ranging from 3.5% to 9.0%. These stocks span industries like real estate, healthcare, finance, and royalties, ensuring diversification and steady payouts.
Here’s a quick overview of the top picks:
- Realty Income (O): 5.6% yield, 667 consecutive monthly dividends.
- Agree Realty (ADC): 4.2% yield, 13 years of dividend growth.
- Main Street Capital (MAIN): 6.75% yield, consistent payouts since 2007.
- STAG Industrial (STAG): 3.93% yield, strong industrial property focus.
- Healthpeak Properties (DOC): 6.84% yield, healthcare REIT.
- Savaria Corporation (SISXF): 3.6% yield, accessibility solutions.
- SIR Royalty Income Fund (SIRZF): 8.4% yield, restaurant royalties.
- Diversified Royalty Corp. (BEVFF): 8.9% yield, trademark royalties.
- Richards Packaging Income Fund (RPKIF): 5% yield, packaging distributor.
- Dynacor Group (DNGDF): 3.6% yield, gold ore processor.
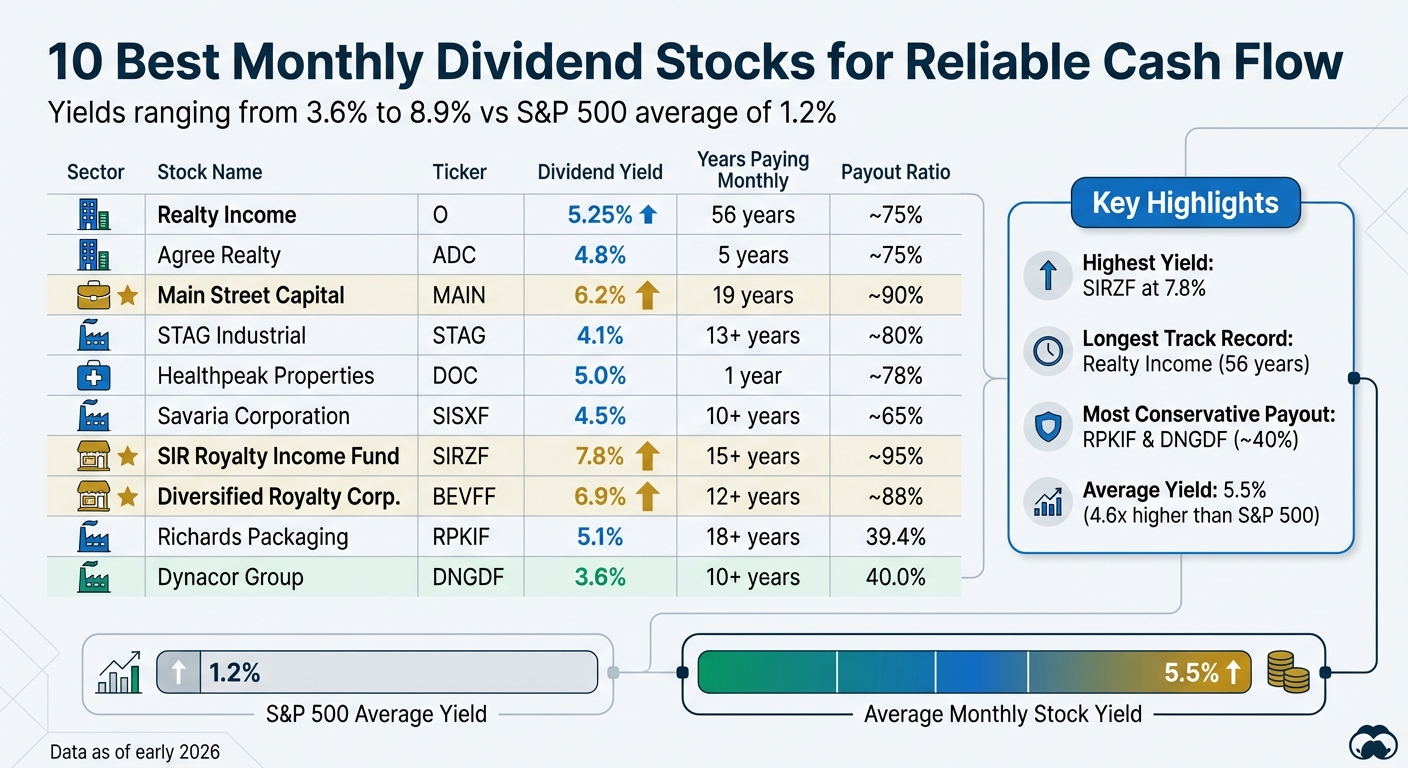
These stocks provide higher yields than the S&P 500 average of 1.2%, offering both income and growth potential. Whether you’re an income-focused investor or looking to reinvest dividends, these stocks are worth considering. Keep an eye on payout ratios, financial health, and tax implications when selecting the right fit for your portfolio.
10 Best Monthly Dividend Stocks Comparison Chart 2026
1. Realty Income (O)

Business Model and Sector
Realty Income stands out in the retail REIT sector thanks to its triple-net lease structure. This setup shifts the responsibility for property taxes, insurance, and maintenance costs to the tenants, ensuring steady and predictable rental income for the company. Their portfolio includes over 15,500 properties leased to 1,647 clients across 92 industries.
Instead of focusing on mall-based retail, Realty Income prioritizes essential retail businesses, which has helped maintain a high occupancy rate – consistently above 96% and reaching 98.7% by late 2025. Nearly half of its tenants boast investment-grade credit ratings, offering an added layer of security against potential defaults. Let’s delve into the company’s dividend performance next.
Dividend Yield
Realty Income provides a forward dividend yield of about 5.6%. With an annual dividend of $3.23 per share and shares priced around $58.48 as of December 7, 2025, the payout remains attractive. The dividend is well-supported, with a payout ratio ranging between 74.7% and 75.37% of Adjusted Funds From Operations (AFFO).
Payout History and Consistency
The company’s dividend history is impressive. Realty Income has distributed 667 consecutive monthly dividends over its 57-year history and recorded more than 100 consecutive dividend increases. Since 1994, dividends have grown at a 4.2% compound annual growth rate, earning the company a spot in the S&P 500 Dividend Aristocrats® index.
Financial Stability
Financially, Realty Income is in a strong position with an A-rated credit profile, outperforming many of its REIT competitors. The company also holds $2.9 billion in liquidity, ensuring it can fund operations and acquisitions effectively. As of Q3 2025, international expansion is a priority, with $1.0 billion allocated to international acquisitions compared to $380 million spent domestically. Its net debt-to-EBITDA ratio stands at 5.4x, reflecting responsible financial management.
2. Agree Realty (ADC)

Business Model and Sector
Agree Realty is a retail-focused REIT operating under a triple-net lease structure. Its portfolio spans 2,422 properties across the 48 continental U.S. states. Unlike mall-centric REITs, ADC targets essential retailers such as grocery stores, home improvement centers, and auto service providers – sectors that are less vulnerable to e-commerce disruptions. Key tenants include major names like Walmart, Tractor Supply, Dollar General, Best Buy, and Kroger, which together contribute about one-third of the company’s rental income. Impressively, the portfolio boasted a 99.6% occupancy rate as of late 2024, with 68.3% of base rent coming from investment-grade tenants. This well-rounded strategy has been a cornerstone of its steady dividend payouts.
Dividend Yield
Agree Realty’s operational strength translates into a compelling dividend yield. The company offers a yield between 4.0% and 4.22%, distributing $0.256 per share monthly – a 2.4% increase from the previous year. This yield is more than three times the S&P 500 average of 1.3%. With a payout ratio of roughly 71.8% to 73% of Adjusted Funds from Operations (AFFO), ADC maintains a conservative approach compared to Realty Income’s 76.2% payout ratio.
Payout History and Consistency
Since its IPO in 1994, Agree Realty has consistently paid dividends, transitioning from quarterly to monthly payouts in January 2021. The company has raised its dividend for 13 consecutive years, achieving an annual growth rate of approximately 5.5% to 6%. Over the past decade, this has resulted in a total dividend increase of 60%.
Financial Stability
ADC’s financial health is backed by a BBB+ investment-grade credit rating. As of Q1 2025, the company had $1.9 billion in total liquidity and a net debt-to-recurring EBITDA ratio of just 3.4 times. In the same quarter, Agree Realty invested $377 million across 69 retail net-lease properties at a 7.3% cap rate, while net income rose by 5.0% to $45.1 million. For 2025, the company expects to invest between $1.3 billion and $1.5 billion, underscoring its ability to sustain growth.
3. Main Street Capital (MAIN)
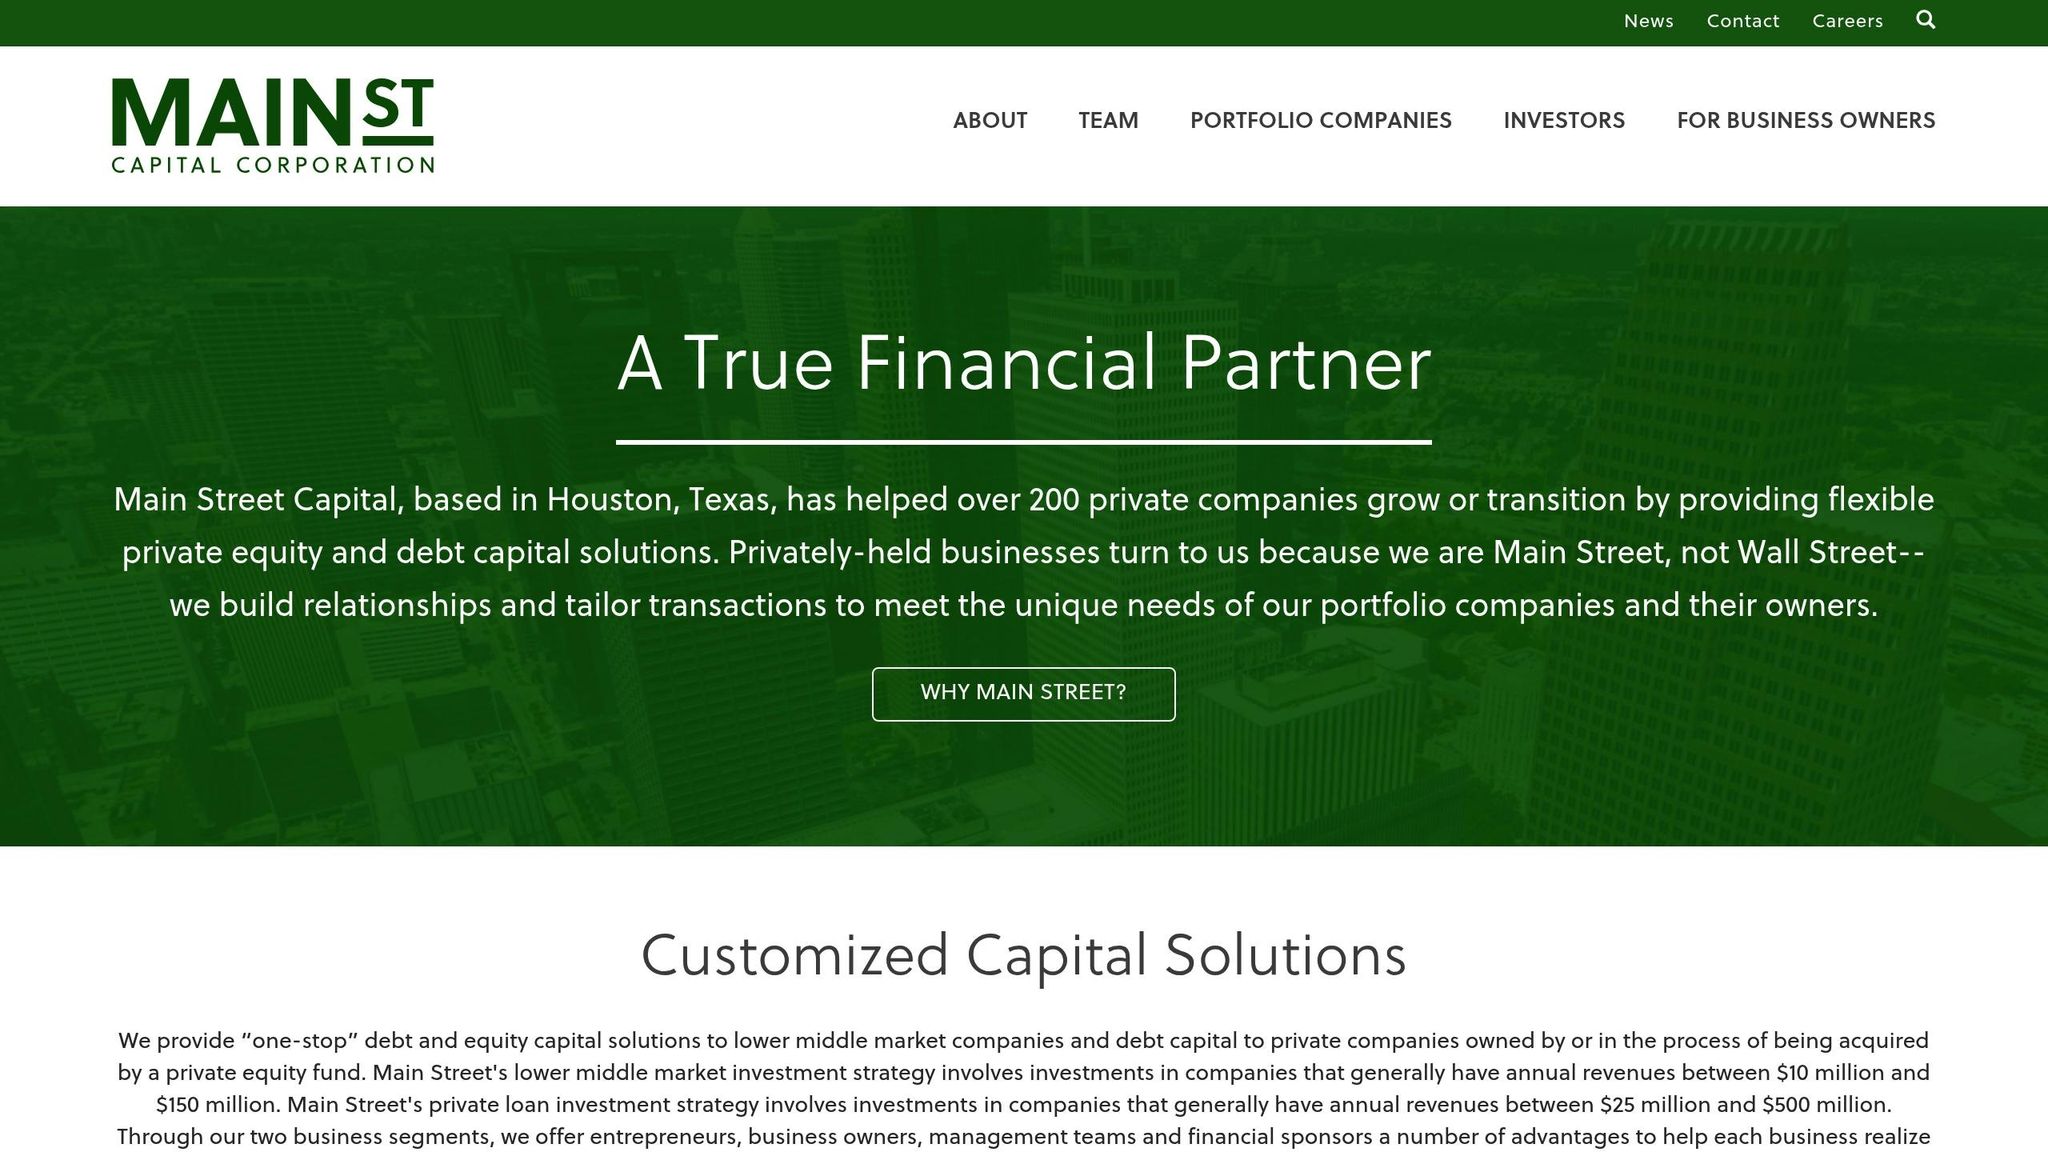
Business Model and Sector
Main Street Capital operates as both a Business Development Company (BDC) and a Small Business Investment Company (SBIC), focusing on financing lower middle market companies. These are businesses with annual revenues ranging from $10 million to $150 million and EBITDA between $3 million and $20 million. MAIN’s investment strategy blends various forms of debt with both control and non-control equity investments. As of Q3 2025, its portfolio included stakes in 88 lower middle market companies valued at $2.8 billion, 11 middle market companies worth $90 million, and 86 private loan investments totaling $1.9 billion. Due to its BDC structure, the company is required to distribute at least 90% of its taxable income to shareholders, ensuring consistent cash flow. This balanced investment approach plays a key role in its strong dividend track record.
Dividend Yield
Main Street Capital offers a forward dividend yield of 6.75% as of January 2026, significantly higher than the S&P 500 average of 1.17%. For Q1 2026, the company announced monthly dividends of $0.26 per share, marking a 4% increase compared to the same period in 2025. Additionally, MAIN paid a supplemental dividend of $0.30 per share in December 2025. It’s worth noting that these dividends are classified as non-qualified, meaning they are taxed as ordinary income.
Payout History and Consistency
Since its IPO in 2007, MAIN has never suspended or reduced its dividend, achieving a 132% increase in payouts over that time. The company follows a two-tier dividend policy, combining a steady monthly base dividend with supplemental quarterly distributions funded by excess investment income. In Q3 2025, net investment income reached $0.97 per share, while distributable net investment income hit $1.03 per share – easily covering the monthly payouts.
Financial Stability
Main Street Capital reported $1.561 billion in liquidity as of Q3 2025, consisting of $30.6 million in cash and $1.53 billion in unused credit capacity. Its debt-to-equity ratio stands at 73.62%, and its net asset value rose 3.6% to $32.78 per share as of September 30, 2025. With a profit margin of 95.59% and a return on equity of 19.07%, MAIN showcases strong operational efficiency. Over the past five years, the company delivered a total return of 189.96%, far outpacing the S&P 500’s 84.17% during the same timeframe.
4. STAG Industrial (STAG)
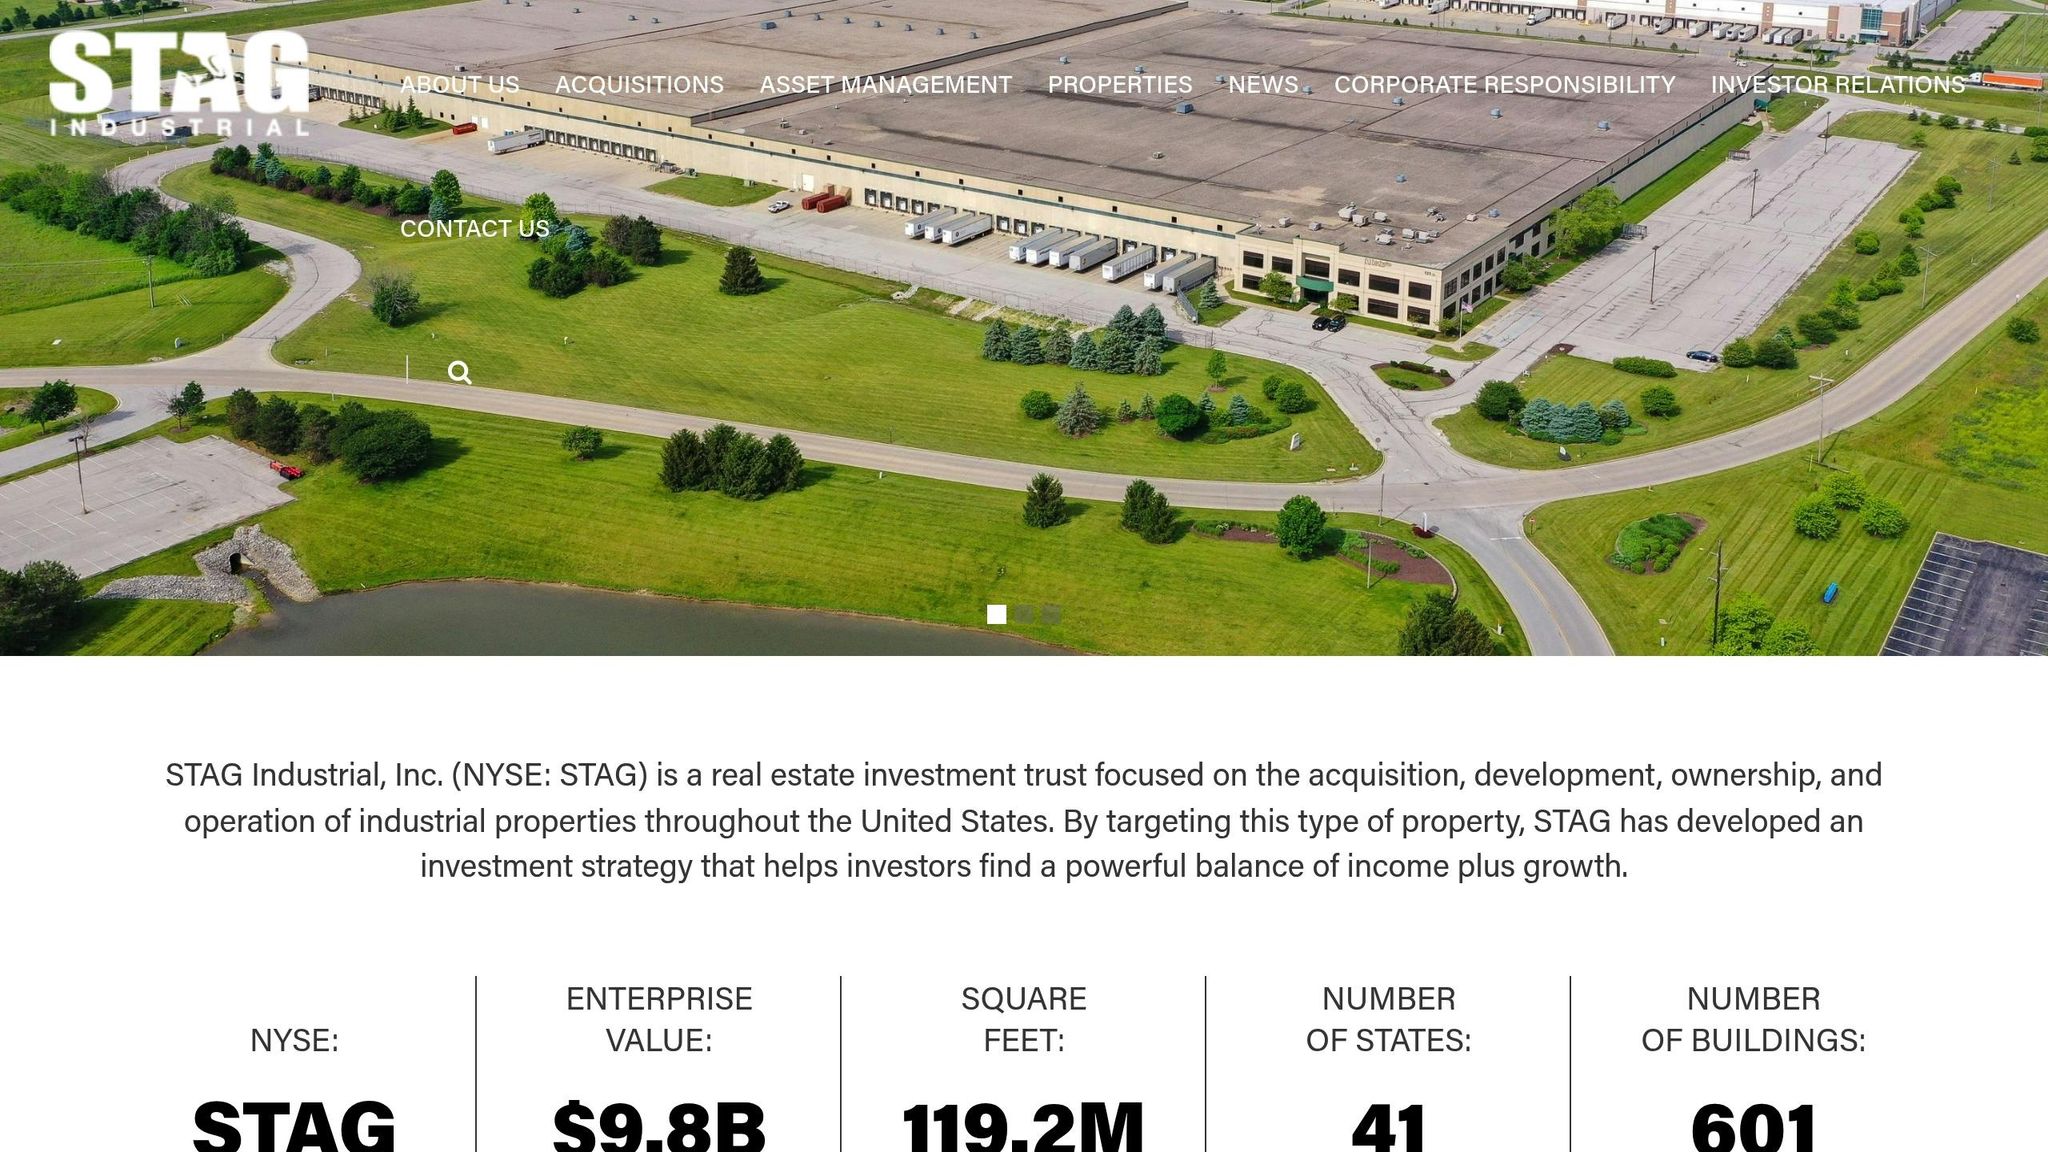
Business Model and Sector
STAG Industrial is a real estate investment trust (REIT) that focuses on single-tenant industrial properties throughout the United States. With a portfolio of nearly 600 buildings spread across 41 states, the company primarily invests in warehouses, distribution centers, and light manufacturing facilities. Notably, about 86% of its properties are dedicated to warehouse and distribution purposes, aligning the company with the ongoing rise in e-commerce, which is projected to account for 30% of retail sales by 2030.
STAG’s strategy revolves around identifying undervalued assets within the fragmented $1 trillion industrial real estate market. While single-tenant properties come with the inherent risk of being either fully occupied or completely vacant, STAG minimizes this risk by conducting thorough tenant evaluations and maintaining a highly diversified portfolio. Since its IPO in 2011, the company has reported credit losses of less than 0.1% of revenues. Additionally, 31% of its tenants hold investment-grade ratings, and 53% are publicly rated, ensuring a strong tenant base. This disciplined approach supports its ability to maintain a reliable dividend strategy.
Dividend Yield
As of January 18, 2026, STAG Industrial offers a dividend yield of 3.93%. While this yield is lower than some of its peers, it stands out by being more than three times the S&P 500 average of 1.17%. Shareholders receive a monthly dividend of $0.1241 per share, totaling $1.49 annually. The company also maintains a cautious payout ratio of around 60% of its projected 2025 funds from operations, offering a buffer compared to competitors that often operate closer to a 100% payout ratio. This conservative approach enhances the reliability of its dividend payments.
Payout History and Consistency
Since going public in 2011, STAG Industrial has consistently increased its monthly dividend, with an average annual growth rate of 1.0% since 2015. As Jason Hall from The Motley Fool pointed out:
Stag should be able to continue increasing its monthly dividend, so long as you’re not expecting big raises.
Financial Stability
STAG’s financial health is reflected in several key metrics. The company boasts an occupancy rate of 96.5%, has secured new leases covering 2.86 million square feet with over 28% cash rent growth, and recently received a "Positive" outlook upgrade from Moody’s. In Q3 2025, its core funds from operations per share grew 8% year-over-year, reaching $0.65. For 2025, management projects core funds from operations per share to fall between $2.52 and $2.54, comfortably covering its $1.49 annual dividend.
5. Healthpeak Properties (DOC)

Business Model and Sector
Healthpeak Properties is a healthcare-focused REIT with a portfolio of roughly 700 properties spread across the United States. The company zeroes in on three main segments: outpatient medical buildings, life science properties, and senior housing communities. This diversified strategy positions Healthpeak to benefit from the aging U.S. population and shifts in healthcare regulations. By prioritizing medical office and life science assets, the company leans into stable, essential healthcare infrastructure, steering clear of more unpredictable sectors. This balanced focus forms the backbone of its steady income strategy.
Dividend Yield
As of January 16, 2026, Healthpeak Properties offers an impressive dividend yield of 6.84%, placing it above 67% of its sector peers and 88% of companies across the U.S. market. Shareholders receive a monthly dividend of $0.102 per share, which totals an annual payout of $1.22 per share. With a share price of $17.83 and a market cap of approximately $12.39 billion, the company provides a solid income stream relative to its stock price.
Payout History and Consistency
In April 2025, Healthpeak switched from quarterly to monthly dividend payments, starting with a monthly rate of $0.102 – an increase of 1.7% over the previous annualized rate. Since then, the company has maintained steady payouts, achieving a modest 1.25% growth rate over the past year. However, it has faced longer-term declines, with dividend reductions of 3.87% over five years and 5.93% over a decade. Notably, Healthpeak has increased its dividend for one consecutive year, reflecting its commitment to rewarding shareholders. The shift to monthly payments aims to provide more consistent cash flow for investors, supported by the company’s robust portfolio of outpatient medical and life science properties.
Financial Stability
Healthpeak retains a strong financial footing, with an estimated $500 million to $1 billion in "dry powder" available for acquisitions or share buybacks. Over the past year, its stock has ranged from a 52-week high of $21.28 in March 2025 to a low of $15.71 in December 2025, reflecting typical REIT market fluctuations. Its focus on essential healthcare real estate adds a layer of stability and resilience to its business model.
6. Savaria Corporation (SISXF)

Business Model and Sector
Savaria Corporation stands out from the usual REIT or BDC profiles by focusing on the accessibility solutions market. The company designs and manufactures products aimed at helping elderly individuals and those with physical challenges maintain their independence. Its operations are divided into three main segments: Accessibility, which generates about 70% of total revenue; Patient Care, contributing 21%; and Adapted Vehicles, which account for less than 10% of revenue.
With production facilities spanning North America, Europe, and Asia, and 30 direct sales offices worldwide, Savaria has established a broad global presence. The company is well-positioned to benefit from demographic trends. By 2030, over 20% of the U.S. population will be aged 65 or older, and nearly 80% of people over 50 wish to "age in place" – remaining in their homes as they grow older. This trend fuels demand for products such as stairlifts and residential elevators, supporting Savaria’s steady monthly dividend payouts.
Dividend Yield
As of mid-2025, Savaria Corporation offers a dividend yield of about 3.6%, more than double the average yield of the S&P 500 Index. While this yield is lower than some industry peers, it aligns with companies like Agree Realty and STAG Industrial. The company pays a monthly dividend of C$0.0467 per share, which translates to roughly $0.39 annually per share for U.S. investors. In September 2025, Savaria increased its dividend by 3.8%, bringing it to the current level. However, U.S. investors should be aware that currency exchange rate fluctuations can impact the actual cash received.
Payout History and Consistency
Savaria has a strong track record of dividend payments. The company transitioned from annual payouts to quarterly in 2013 and then to monthly in late 2017. It has consistently raised its dividend for 12 consecutive years in local currency. Additionally, the payout ratio has improved significantly, dropping from 79% in 2024 to about 55.7% by mid-2025, highlighting the dividend’s sustainability.
This improvement reflects Savaria’s solid earnings performance. In Q3 2025, the company reported $159.6 million in revenue, a 5.2% increase compared to the same period in 2024. Net earnings also rose sharply, climbing to $13.8 million from $7.9 million in Q3 2024.
Financial Stability
Savaria demonstrates strong financial health, with a net debt ratio of 1.63 at the close of 2024 and $242.8 million available for future growth initiatives. The company’s operational efficiency is evident in its adjusted EBITDA margin of 21.2% for Q3 2025.
Looking ahead, the global market for accessibility solutions is projected to grow at an annual rate of 6% through 2030, providing a favorable environment for Savaria’s continued expansion. The company also focuses on strategic acquisitions of smaller players in the industry, further consolidating its position and enhancing its growth potential.
7. SIR Royalty Income Fund (SIRZF)
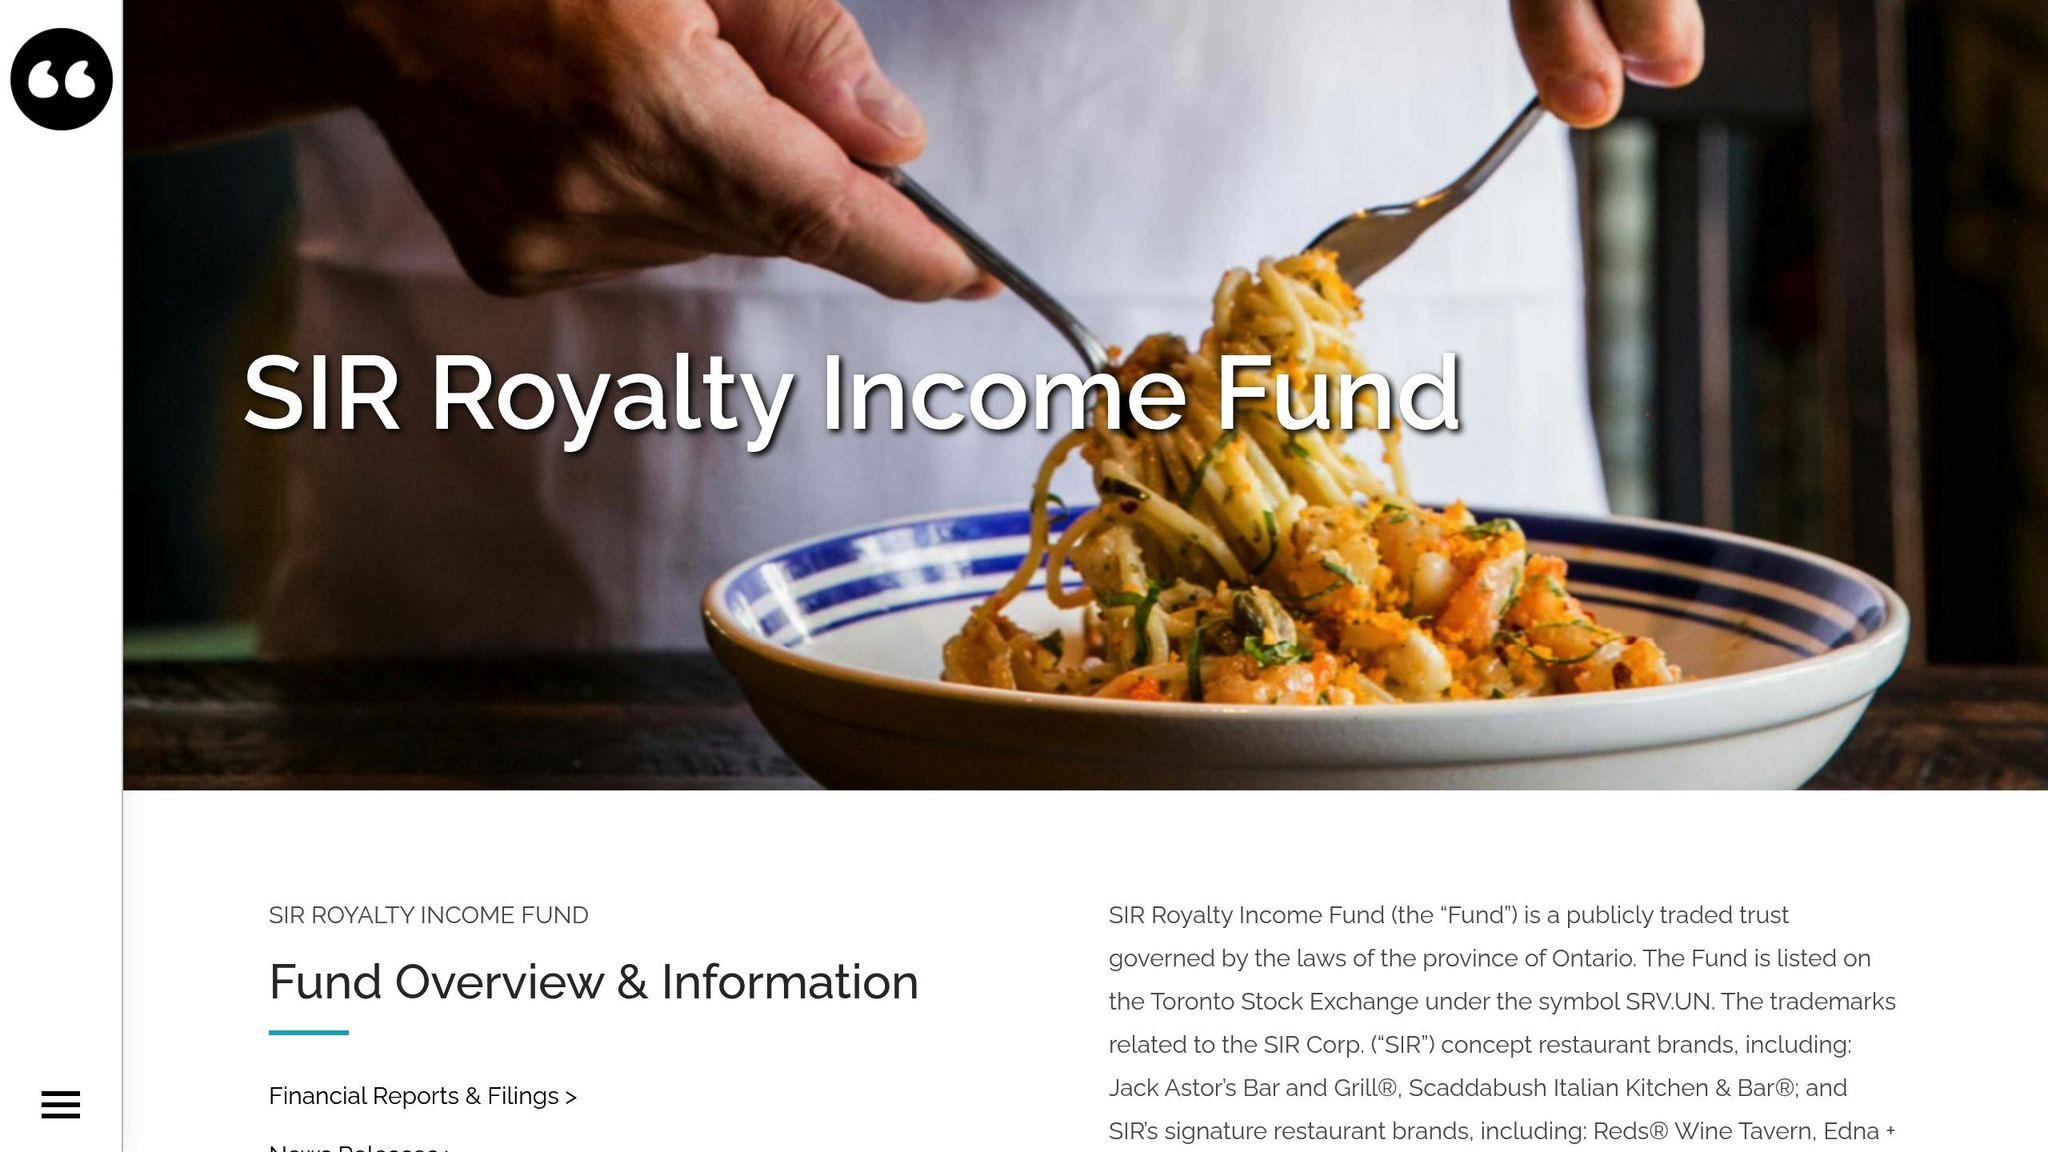
Business Model and Sector
SIR Royalty Income Fund operates as a Canadian entity that earns its income through royalties from specific restaurant brands owned by SIR Corp. As of January 1, 2025, the fund holds royalty claims on 52 restaurant locations, with 45 of them located in Ontario, primarily in the Greater Toronto area. Its revenue largely comes from two major brands: Jack Astor’s, a bar and grill chain, and Scaddabush, an Italian kitchen and bar, along with a few smaller brands. Unlike models based on net profit, this fund’s royalty income is tied to gross sales. This approach shields it from fluctuations in operational costs, though it remains influenced by consumer spending patterns. This structure plays a key role in supporting its appealing dividend yield.
Dividend Yield
As of January 2026, SIR Royalty Income Fund offers a dividend yield of 8.4%, which stands out as one of the higher yields among stocks on this list.
Payout History and Consistency
SIR Royalty Income Fund has shown resilience in the often-volatile restaurant sector. During the 16-week fiscal Q4 period reported in November 2025, food and beverage revenue from corporate operations rose by 4.0% year-over-year, reaching $94.1 million CAD. Consolidated same-store sales also grew by 2.7%, demonstrating the continued appeal of the fund’s brands despite economic pressures. Additionally, SIR Corp. retains a 16% ownership stake, aligning its management’s interests with those of shareholders. This alignment, combined with the fund’s financial health, supports its steady monthly distributions.
Financial Stability
Operating predominantly in Ontario, especially in the Toronto area, the fund benefits from a large and stable urban market. However, this geographic focus does limit its diversification. That said, the recent growth in revenue and same-store sales highlights the strength of its core brands, reinforcing its ability to maintain regular monthly dividend payments.
sbb-itb-484be5d
8. Diversified Royalty Corp. (BEVFF)
Business Model and Sector
Diversified Royalty Corp. focuses on acquiring trademark and royalty rights from established, multi-location brands across North America. Its revenue comes from top-line system sales, agent counts, or fixed payments under long-term agreements that are often linked to inflation. Recently, the company expanded into the U.S. by acquiring Stratus, a commercial cleaning franchisor with an impressive 21% annual sales growth.
The company’s portfolio features a diverse range of well-known brands, including Mr. Lube + Tires, AIR MILES, Sutton, Oxford Learning Centers, Mr. Mikes, Nurse Next Door, Stratus, and BarBurrito. Unlike traditional equity investments, Diversified Royalty generates revenue without taking on the operational expenses or debts of the businesses it works with. This creates a steady and predictable income stream.
Dividend Yield
Thanks to its stable revenue structure, Diversified Royalty Corp. supports an appealing dividend policy. As of early 2025, the company offers a dividend yield of 8.9%, making it one of the higher-yielding options in this space. On July 4, 2025, the company increased its monthly dividend by 10.1%, bringing it to CAD$0.0229 per share. U.S. investors should keep in mind that currency fluctuations between the Canadian and U.S. dollars can influence the actual payout amount, even when the dividend remains stable in CAD.
Payout History and Consistency
Diversified Royalty has a strong track record of maintaining its dividend payouts. During the challenging 2020–2021 period, the company avoided cutting dividends. After six years of steady payouts, it raised its dividend by 2% in early 2025 and followed up with a 10.1% increase in July. Since its inception, the company has paid out a total of $269.1 million in dividends. In Q3 2025, distributable cash per share rose to approximately $0.0472, up from $0.0451 during the same period the previous year.
Financial Stability
In 2024, Diversified Royalty reported annual revenue of $65.0 million, reflecting a 15% increase, while distributable cash grew by 17.5% to $44.8 million. Additionally, its average earnings per share (EPS) saw a 10.2% annual growth rate from 2016 to 2024. However, the company’s high payout ratio – 90.0% for 2024 and 82.3% in Q4 – along with its significant debt, presents potential risks during severe economic downturns.
The company’s diversification across essential service sectors like automotive maintenance, commercial cleaning, and education helps shield it from economic fluctuations. Still, performance varies among its portfolio brands. For instance, Mr. Lube + Tires achieved impressive same-store sales growth of 12.0% in late 2024, while Mr. Mikes faced a decline of -4.7%. This mix of high yield and careful financial management makes Diversified Royalty Corp. a reliable choice for monthly dividend income, though investors should weigh the risks tied to its payout ratio and debt levels.
9. Richards Packaging Income Fund (RPKIF)

Business Model and Sector
Richards Packaging Income Fund stands out as Canada’s largest packaging distributor and ranks third in North America. The company sources over 8,000 SKUs from more than 900 suppliers, serving 18,000 customers across industries like healthcare, food and beverage, and cosmetics.
Currently, more than 52% of its revenue comes from healthcare products, including medical, aesthetic, vision care, and surgical supplies – areas known for steady demand. In 2020, the fund expanded its healthcare offerings by acquiring Clarion Medical Technologies. By Q3 2025, Richards Packaging reported an 11.1% revenue increase, reaching $78.11 million, driven by acquisitions and growth in its healthcare segment. This focus on healthcare positions the fund as a reliable income generator.
Dividend Yield
As of early 2025, Richards Packaging provides a monthly dividend yield of about 5%. The fund has also issued special distributions in recent years: $0.546 in March 2022, $0.277 in March 2023, and $0.265 in March 2024. This yield is more than triple the S&P 500’s average yield of approximately 1.5%.
Payout History and Consistency
Richards Packaging has built a strong reputation for consistency, paying monthly dividends for 14 years straight, with the only disruption occurring during the Great Financial Crisis. Over the past nine years, the dividend per unit has grown at a compound annual growth rate (CAGR) of 4.6%.
Financial Stability
The fund maintains a conservative financial approach. Its payout ratio has improved from 62% in 2012 to 59% in 2024, and it has no outstanding debt as of early 2025. Management is targeting 2%–5% organic revenue growth in 2025, supported by smaller, strategic acquisitions. Additionally, with insiders owning 15% of the fund, there’s a strong signal of stability and alignment with investors.
10. Dynacor Group (DNGDF)
Business Model and Sector
Dynacor Group operates in the gold industry as an industrial processor. Instead of engaging in mining or exploration, the company purchases high-grade ore from artisanal and small-scale miners across Peru. This ore is processed at their Veta Dorada plant in Chala, which has a daily capacity of 430 tons.
This approach allows Dynacor to avoid the high risks and costs tied to exploration and direct mining. By relying on a network of established ore suppliers, the company has built a stable and predictable operation. Over the past decade, Dynacor has expanded its supplier network, achieving an average annual production growth rate of 6.1%. This operational stability supports the company’s reliable monthly dividend payouts.
Dividend Yield
As of early 2026, Dynacor’s dividend yield stands at 3.6%, with payments made monthly. While this yield may not be the highest among monthly payers, it is still three times the S&P 500’s average yield of about 1.5%. The company’s dividends are bolstered by strong gold prices, which climbed to $3,494 per ounce in Q3 2025, up significantly from $2,485 in Q3 2024.
Payout History and Consistency
Dynacor maintains a conservative payout ratio of 39–40%, ensuring a buffer for its monthly dividends even when gold prices fluctuate. This cautious approach has allowed the company to sustain its distributions over time. From 2020 to 2024, Dynacor’s earnings per share grew steadily, reaching an all-time high of $0.46 in 2024, compared to $0.11 in 2020.
Financial Stability
Dynacor stands out for its financial strength. The company operates with zero debt and holds a net cash position of $57 million, which accounts for roughly 40% of its total market capitalization. Remarkably, Dynacor earns more in interest income than it pays in interest expenses – an uncommon achievement in its sector. In Q3 2025, the company reported record-breaking quarterly revenue of $100.5 million, marking a 31.9% year-over-year increase. With its debt-free operations, strong cash reserves, and prudent payout strategy, Dynacor has been recognized by analysts as the #2 safest monthly dividend stock.
I Reviewed ALL 55 Monthly Dividend Stocks… Only a Few Survived
Stock Comparison Table
Below is a detailed comparison of various stocks, highlighting their ticker symbols, dividend yields, years of monthly dividend payments, payout ratios, and market caps as of early 2026.
| Stock | Ticker | Dividend Yield | Years of Monthly Payments | Payout Ratio | Market Cap |
|---|---|---|---|---|---|
| Realty Income | O | 5.25% | 56 years | ~75% (AFFO) | $57.0B |
| Agree Realty | ADC | 4.8% | 5 years (since 2021) | ~75% (AFFO) | $6.2B |
| Main Street Capital | MAIN | 6.2% | 19 years (since 2007) | ~90% | $5.7B |
| STAG Industrial | STAG | 4.1% | 13+ years | ~80% (AFFO) | $7.1B |
| Healthpeak Properties | DOC | 5.0% | 1 year (since early 2025) | ~78% (AFFO) | $8.5B |
| Savaria Corporation | SISXF | 4.5% | 10+ years | ~65% | $1.0B |
| SIR Royalty Income Fund | SIRZF | 7.8% | 15+ years | ~95% | $0.3B |
| Diversified Royalty Corp. | BEVFF | 6.9% | 12+ years | ~88% | $0.4B |
| Richards Packaging Income Fund | RPKIF | 5.1% | 18+ years | 39.4% | $0.6B |
| Dynacor Group | DNGDF | 3.6% | 10+ years | 40.0% | $0.14B |
Realty Income stands out with its impressive scale and a 56-year streak of uninterrupted monthly dividends, supported by a market cap of $57 billion.
For those prioritizing conservative payout policies, Richards Packaging Income Fund and Dynacor Group lead the way with payout ratios of 39.4% and 40.0%, respectively, providing a solid buffer for their monthly distributions.
Dividend yields across these stocks vary widely, from Dynacor Group’s 3.6% to SIR Royalty Income Fund’s 7.8%, all offering much higher income potential compared to the S&P 500’s approximate 1.2% yield. Notably, Main Street Capital has maintained a consistent monthly dividend since 2007, increasing its payout by 132% over that time without ever reducing it.
Several stocks have more recently transitioned to monthly dividend payments, offering fresh opportunities for income-focused investors. Refer to the table above for a concise overview of these metrics.
Conclusion
Monthly dividend stocks offer a steady cash flow that aligns well with the way most people manage their finances. As Glenn Fydenkevez from U.S. News & World Report points out:
Most people organize their financial lives according to a monthly schedule. Because people generally set their budget monthly and pay their bills monthly, monthly dividends just work better with the financial calendar they’re used to.
This natural fit makes budgeting easier, whether you’re looking to supplement retirement income or grow a passive income stream.
The 10 stocks highlighted in this article showcase a variety of opportunities. From Realty Income’s decades-long history of reliable payouts to newer entrants like Healthpeak Properties, these companies have been carefully reviewed for their ability to sustain monthly distributions. With yields significantly higher than the S&P 500’s average of ~1.2%, these stocks not only provide meaningful income but also allow for faster compounding through frequent reinvestment.
However, it’s important to approach these investments thoughtfully. Bob Ciura from Sure Dividend emphasizes:
Monthly dividend stocks can be an attractive investment option for those seeking stable income. That is because monthly dividend stocks provide a predictable and consistent stream of cash flow.
That said, thorough research is crucial. Evaluating factors like payout ratios, debt levels, and overall business health is essential, as high yields can sometimes signal financial strain rather than opportunity.
Finally, don’t overlook other key considerations. For instance, REIT dividends are taxed as ordinary income, making tax-advantaged accounts like IRAs a smart choice for holding these investments. Diversifying across sectors is also critical to protect your portfolio from risks tied to specific industries. By balancing these factors, monthly dividend stocks can become a valuable part of a well-rounded investment strategy.
FAQs
What should I know about taxes on monthly dividend stocks?
Taxes on monthly dividend stocks hinge on a few key factors, primarily whether the dividends are categorized as qualified dividends or ordinary income. Qualified dividends generally benefit from lower tax rates, while ordinary dividends are taxed at your standard income tax rate.
If you’re holding these stocks in a tax-advantaged account like an IRA or 401(k), you might be able to defer or even avoid taxes on the dividends. On the other hand, if the stocks are in a taxable account, you’ll need to include the dividend income on your tax return, and state taxes may also come into play. For guidance tailored to your situation, it’s a smart idea to consult a financial or tax professional well-versed in U.S. tax laws.
What should I look for when evaluating the financial stability of a company with high dividend yields?
To assess the financial health of a high-yield dividend company, start by focusing on the payout ratio. This metric reveals how much of the company’s earnings are allocated to dividends. A payout ratio under 75% is generally a good sign, suggesting the dividend is not only sustainable but may also have room to grow. It’s also important to evaluate whether the company generates steady cash flow and has a history of maintaining or increasing its dividend payments.
Next, dig into the company’s financial strength. Key indicators include the debt-to-equity ratio and market capitalization. Companies with a market cap exceeding $1 billion and manageable debt levels tend to be more resilient and better prepared to weather economic changes. For specific industries like REITs, it’s crucial to examine predictable income sources, such as rental revenue, which can support consistent dividend payouts.
Lastly, consider long-term trends in earnings and cash flow. A company with stable or growing earnings and a proven track record of regular dividend payments is often a sign of financial stability. By keeping an eye on these factors, you can determine whether a high dividend yield signals a reliable opportunity or a potential risk.
How do monthly dividend stocks help with budgeting and financial planning?
Monthly dividend stocks offer a dependable way to generate income, which can be particularly helpful for covering regular expenses like rent, utilities, or other recurring bills. Their consistent payouts make it easier for investors to manage day-to-day budgets and work toward both short-term and long-term financial goals.
Unlike quarterly or annual dividends, monthly payouts help ensure a steady cash flow. This reduces the chances of experiencing income gaps, making these stocks appealing for anyone looking for frequent and reliable income.


