

Gamma exposure, commonly abbreviated as GEX, represents one of the most powerful yet misunderstood forces driving modern stock market movements.
Understanding gamma exposure is essential for options traders, active investors, and anyone seeking to comprehend why stocks sometimes move with explosive momentum or grind sideways in tight ranges.
What Is Gamma Exposure in Options Trading?
Gamma exposure (GEX) measures the rate of change in an option’s delta relative to movements in the underlying stock price.
More specifically, gamma exposure represents the aggregate positioning of market makers who must hedge their options inventory by buying or selling the underlying stock.
When institutional traders and retail investors buy or sell options contracts, market makers take the opposite side of these trades. To remain neutral and manage risk, market makers must continuously hedge their exposure by adjusting their stock positions.
Gamma exposure quantifies this hedging pressure.
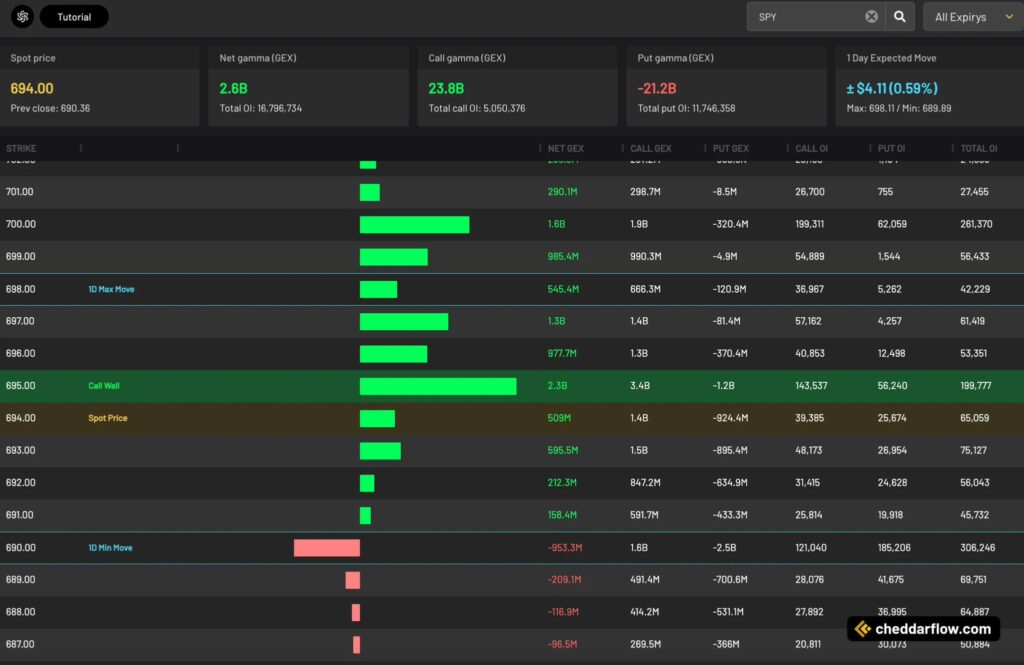
In the SPY options chain shown above, we can see several key metrics:
- Net gamma exposure: $2.6 billion (positive)
- Call gamma: $23.8 billion
- Put gamma: -$21.2 billion
- Total open interest: 16,796,734 contracts
This positive net gamma environment creates specific price dynamics that sophisticated traders monitor closely.
How Gamma Exposure Works: The Market Maker Perspective
Market makers are the invisible hand behind options trading.
When you buy a call option, a market maker sells it to you and immediately becomes short that call. To hedge this short call position, the market maker must buy shares of the underlying stock.
The gamma exposure calculation determines how many shares market makers need to buy or sell as the stock price moves.
High gamma exposure creates mechanical buying and selling pressure that amplifies or dampens price movements depending on whether the gamma is positive or negative.
Consider a practical example using the SPY data above:
- Current price: $694.00
- Gamma concentration: $695 strike shows 2.3B in net GEX
- Effect: This level acts as a “gamma wall” where market maker hedging activity creates price resistance
Positive Gamma Exposure vs Negative Gamma Exposure
Understanding the difference between positive and negative gamma exposure is crucial for predicting market behavior.
Positive Gamma Exposure (Long Gamma)
Positive gamma exposure occurs when market makers are net short options, meaning retail traders and institutions are net long options.
In this environment, market makers must buy stock as prices rise and sell stock as prices fall. This creates a dampening effect on volatility.
The SPY example displays positive net gamma of $2.6 billion. This positive gamma environment typically results in range-bound, grinding price action with lower realized volatility.
Market maker hedging actively works against trending moves, creating natural support and resistance levels.
Characteristics of positive gamma environments:
- Reduced intraday volatility
- Mean-reverting price action
- Choppy sideways markets
- Strong support at strike prices with concentrated gamma exposure
- Difficult conditions for trend-following strategies
Negative Gamma Exposure (Short Gamma)
Negative gamma exposure occurs when market makers are net long options, meaning institutions and traders are net short options.
This forces market makers to sell stock as prices decline and buy stock as prices rally, amplifying momentum in both directions.
Negative gamma environments create explosive volatility. When market maker hedging flows align with directional momentum, moves accelerate rapidly.
This explains why some market selloffs cascade with seemingly unstoppable force.
Characteristics of negative gamma environments:
- Explosive intraday volatility
- Trend-following price action
- Momentum acceleration in both directions
- Reduced support/resistance at key levels
- “Air pockets” where prices move rapidly
Looking at the SPY gamma profile, the 690 strike shows -953.3M in net gamma exposure.
If SPY were to break below this level, market makers would need to sell significant stock inventory, potentially accelerating downside momentum.
Reading Gamma Exposure Charts: A Practical Guide
The gamma exposure chart from Cheddarflow provides critical intelligence about where market makers have concentrated risk exposure.
Let me break down how to interpret this data.
Key Gamma Exposure Metrics
Understanding the top-level metrics is essential before diving into strike-by-strike analysis:
Net Gamma (GEX): The $2.6B figure represents the net exposure across all strikes.
Positive values indicate stabilizing forces, while negative values suggest potential volatility.
Call Gamma (GEX): The $23.8B in call gamma shows enormous long call positioning, primarily from retail traders and institutions betting on upside.
Put Gamma (GEX): The -$21.2B in put gamma reveals substantial put buying, likely protective puts or bearish speculation.
Total Open Interest: With 16,796,734 total contracts open, the SPY options complex represents massive institutional positioning that drives underlying stock movements.
Expected Move: The 1-day expected move of ±$4.11 (0.59%) indicates how much the market anticipates SPY to move based on current options pricing.
Strike-by-Strike Gamma Analysis
The visual gamma profile reveals critical price levels where hedging flows concentrate.
Here’s what the key strikes tell us:
$700 Strike (Resistance Zone):
- Net gamma: 1.6B
- Call open interest: 199,311 contracts
- Put open interest: 62,059 contracts
- Significance: Major resistance where market makers have substantial short gamma exposure
$695 Strike (The “Call Wall”):
- Net gamma: 2.3B (heaviest concentration)
- Total open interest: 189,777 contracts
- Significance: Creates powerful magnet effect, pulling price toward this level
- Market maker hedging: Most concentrated at this strike
$694 Strike (Current Spot Price):
- Current trading level: $694.00
- Previous close: $690.36
- Net gamma: 509M
- Significance: At-the-money with moderate gamma exposure
$690 Strike (Critical Support – “1D Min Move”):
- Net gamma: -953.3M (negative!)
- Total open interest: 306,246 contracts
- Significance: First major negative gamma level
- Risk: Breaking below triggers accelerated selling from market maker hedging
How Gamma Exposure Affects Stock Price Movement
Gamma exposure directly influences how aggressively market makers must hedge their positions, which in turn affects stock price volatility and direction.
Gamma Squeeze Dynamics
When stocks approach strikes with massive positive gamma, market makers who are short those strikes must buy increasing amounts of stock as the price rises.
This buying pressure pushes prices higher, which requires more hedging, creating a feedback loop called a “gamma squeeze.”
The SPY options chain shows this setup clearly. The clustering of positive gamma between $695-$700 creates conditions where upside momentum could accelerate.
How a gamma squeeze develops:
- Stock price approaches high-gamma strike
- Market makers short calls at that strike
- Rising price increases their delta exposure
- They must buy stock to hedge delta
- Their buying pushes price higher
- Cycle repeats, accelerating momentum
Gamma Flip Scenarios
A “gamma flip” occurs when net gamma switches from positive to negative or vice versa.
These transitions create regime changes in market behavior.
Current SPY dynamics:
- Above $695: Market tends toward stability (positive gamma)
- Below $690: Volatility could spike dramatically (negative gamma territory)
- Expected range: $689.89 to $698.11 based on ±$4.11 (0.59%) expected move
The expected 1-day move of ±$4.11 (0.59%) reflects current implied volatility and gamma positioning.
This relatively tight expected range confirms the stabilizing influence of positive net gamma.
Using Gamma Exposure in Your Trading Strategy
Sophisticated traders incorporate gamma exposure analysis into their decision-making process to gain edge over less-informed market participants.
Identifying Key Support and Resistance Levels
Strikes with concentrated gamma exposure act as price magnets.
The $695 call wall in SPY serves as both a target for upward movement and potential resistance. Price tends to gravitate toward these high-gamma strikes as market makers hedge their exposure.
Key levels from current SPY profile:
- Resistance: $700 strike (1.6B gamma)
- Target/Magnet: $695 strike (2.3B gamma – heaviest concentration)
- Support: $694 spot price (509M gamma)
- Critical support: $690 strike (-953.3M gamma)
Conversely, the $690 strike with significant negative gamma represents a critical support level.
Breaking below this triggers accelerated selling from market maker hedging, making it a logical stop-loss level for long positions.
Volatility Forecasting with Gamma Metrics
High positive gamma environments typically precede periods of compressed volatility.
When net gamma exposure reaches extreme positive levels like the current $2.6B in SPY, options strategies that profit from low volatility become attractive.
Best strategies for positive gamma environments:
- Iron condors
- Short straddles (undefined risk)
- Calendar spreads
- Credit spreads
Conversely, as gamma approaches neutral or flips negative, preparing for volatility expansion makes sense.
Best strategies for negative gamma environments:
- Long straddles
- Long strangles
- Directional options positions
- Protective puts
Timing Entry and Exit Points
Experienced traders use gamma exposure data to refine entry timing.
Entering long positions near strikes with heavy negative gamma provides a “cushion” where market maker selling has likely exhausted itself.
Similarly, taking profits near major positive gamma strikes makes sense as these levels create natural resistance.
Trade structure based on current SPY gamma profile:
- Entry zone: Near $690 support
- Stop loss: Below $690 (negative gamma acceleration zone)
- Target: $695-$700 gamma wall
- Risk/reward: Favorable setup aligning with market maker flows
For the current SPY setup, long positions entered near $690 with stops below target the $695-$700 gamma wall as a profit zone.
This trade structure aligns with market maker hedging flows rather than fighting against them.
Gamma Exposure and Market Maker Hedging Activity
Understanding market maker incentives and constraints is essential for proper gamma exposure interpretation.
Market makers aren’t taking directional bets—they’re managing inventory risk while capturing bid-ask spreads.
Delta Hedging Requirements
Market makers must maintain delta-neutral books to avoid directional risk.
When they sell a call option, they immediately buy stock to offset the positive delta. As the stock price moves, the delta of that call option changes based on the option’s gamma.
Current SPY hedging dynamics:
- Call gamma: $23.8B (market makers collectively short massive calls)
- Hedging behavior: Each $1 SPY moves higher increases their delta exposure
- Required action: Must buy more shares as price rises
- Opposite effect: Each $1 lower reduces delta, forcing share sales
With $23.8B in call gamma exposure, SPY market makers are collectively short massive amounts of calls.
Each dollar SPY moves higher increases their delta exposure, forcing them to buy more shares. Each dollar lower reduces delta exposure, forcing them to sell shares.
Hedging Flow Amplification
The feedback loop created by gamma hedging amplifies existing price trends in negative gamma environments and dampens trends in positive gamma environments.
This explains why markets sometimes exhibit violent momentum and other times grind sideways despite significant news flow.
Positive gamma effect (current SPY environment):
- Net gamma: +$2.6B
- Market behavior: Choppy, range-bound action
- Hedging action: Market makers work against momentum
- Trader experience: Frustrating for trend-followers, ideal for range traders
Negative gamma effect (if SPY breaks below $690):
- Gamma switches negative
- Market behavior: Explosive moves in direction of break
- Hedging action: Market makers amplify momentum
- Trader experience: Trend-following strategies excel
Current SPY positioning with $2.6B net positive gamma suggests market makers are working against momentum.
This creates the choppy, range-bound action frustrating trend-followers but beloved by range-trading systems.
Gamma Exposure vs Other Options Greeks
While gamma exposure receives significant attention, understanding how it relates to other options Greeks provides complete picture of options risk.
Gamma vs Delta
Delta: Measures directional exposure—how much an option’s price changes for each $1 move in the underlying stock.
Gamma: Measures how quickly that delta changes.
High gamma means delta changes rapidly, requiring frequent rehedging by market makers.
Example:
- At-the-money call option: 0.50 delta, 0.05 gamma
- Stock rises $1
- New delta: 0.55
- The rate of that delta change is gamma
Gamma vs Theta
Theta: Represents time decay—the erosion of option value as expiration approaches.
Relationship: Gamma and theta have an inverse relationship.
Key insight: Options with high gamma (typically at-the-money options near expiration) also have high theta decay.
The SPY options shown likely include significant weekly and monthly expiration contracts:
- Near-term expirations: Higher gamma but faster decay
- Longer-dated options: Lower gamma but retain value longer
Gamma vs Vega
Vega: Measures sensitivity to implied volatility changes.
When implied volatility expands, option prices increase even if the underlying stock remains unchanged.
Market dynamics:
- High vega environments often coincide with negative gamma regimes
- Both indicate uncertainty and potential for large moves
- Current 1-day expected move: 0.59% (compressed volatility)
The 1-day expected move of 0.59% reflects current implied volatility levels.
If news catalysts emerge causing volatility expansion, both vega and gamma dynamics would shift significantly.
Common Gamma Exposure Patterns in Major Indices
SPY, QQQ, and IWM each display characteristic gamma exposure patterns based on their options activity and trader positioning.
SPY Gamma Exposure Characteristics
SPY represents the S&P 500 and sees the highest options volume of any security. Institutional hedging activity dominates SPY options, creating large positive gamma environments during stable market conditions. The current $2.6B positive gamma fits this typical pattern.
SPY gamma exposure tends to concentrate at round numbers and psychological levels. The clustering at $695 and $700 reflects this behavior, as traders anchor on these strikes for both speculation and hedging.
How Gamma Exposure Changes Around Major Events
Earnings seasons, Federal Reserve announcements, and economic data releases dramatically alter gamma exposure profiles. Traders adjust their options positions in anticipation, shifting gamma concentrations.
Currently, with the 1-day expected move at just 0.59%, the market appears to be in a low-catalyst environment. This changes rapidly around FOMC meetings or major earnings reports, when expected moves can double or triple.
Weekly vs Monthly Options Gamma Profiles
The explosion of zero-day-to-expiration (0DTE) and weekly options trading has fundamentally altered gamma dynamics. Short-dated options carry disproportionate gamma relative to longer-dated contracts.
Many of the SPY strikes shown include both weekly and monthly expirations. The total open interest of 16.7 million contracts represents a mix of time frames, with shorter-dated contracts wielding outsized influence on intraday price action.
Tools and Platforms for Monitoring Gamma Exposure
Accessing real-time gamma exposure data has become easier with modern trading platforms, though quality varies significantly.
Premium Gamma Exposure Platforms
Cheddarflow, the platform shown in the screenshot, provides institutional-grade options flow and gamma exposure data.
Top-tier gamma analysis services:
Cheddarflow:
- Real-time options flow and gamma exposure
- Visual gamma profiles like the SPY chart shown
- Strike-by-strike analysis
- Pricing: Premium subscription required
SpotGamma:
- Comprehensive gamma exposure models
- Daily gamma commentary and analysis
- Focus on index-level positioning
- Pricing: $50-$150/month
Tradytics:
- Options flow and unusual activity
- Gamma exposure dashboards
- AI-powered pattern recognition
- Pricing: $70-$200/month
SqueezeMetrics:
- Institutional-level dark pool data
- Gamma exposure index (GEX)
- Advanced volatility metrics
- Pricing: $300+/month
These platforms calculate net gamma exposure across all strikes and expirations, providing the aggregate hedging pressure data essential for informed trading decisions.
Monthly subscriptions typically range from $50-$300 depending on features.
Free Gamma Exposure Resources
While premium platforms offer superior data quality, free alternatives exist for budget-conscious traders.
Broker-provided options data:
- Most brokers show basic options chains
- Open interest by strike
- Volume data
- Bid/ask spreads
- Limitations: No calculated gamma exposure aggregates
CBOE market indicators (free):
- Put/Call ratios (correlate with gamma positioning)
- VIX and VVIX (volatility indices)
- Skew metrics (implied volatility by strike)
- SKEW index (tail risk indicator)
- Access: Available on CBOE.com
Manual gamma calculation approach:
Advanced traders can calculate approximate gamma exposure:
- Download options chain data from broker
- Calculate gamma for each option using Black-Scholes
- Multiply gamma × open interest × shares per contract
- Sum across all strikes
- Adjust for call vs put positioning
Free community resources:
- Reddit r/options (gamma discussions)
- Twitter/X options flow accounts
- TradingView scripts and indicators
- Financial media gamma commentary
The CBOE publishes aggregate market data including put/call ratios and skew metrics that correlate with gamma positioning.
These offer directional insights even without precise gamma calculations.
Interpreting Real-Time Gamma Changes
Gamma exposure isn’t static—it changes constantly as traders open and close positions and as time decay affects options prices.
Monitoring intraday gamma shifts reveals changing market dynamics.
Key factors that change gamma exposure:
- New positions: Large institutional trades opening or closing
- Time decay: Options approaching expiration see gamma spike (ATM) or decay (OTM)
- Price movement: As stock moves, different strikes become ATM/OTM
- Volatility changes: Implied volatility shifts affect option prices and gamma
Signs of significant gamma repositioning:
- Unusual volume at specific strikes (10x+ average)
- Large block trades in options (>1,000 contracts)
- Rapid shifts in put/call ratio
- Sudden changes in implied volatility
- Price action contradicting expected gamma effects
Significant moves in SPY options volume or unusual activity at specific strikes signals institutional repositioning.
When large trades hit at strikes with existing heavy gamma, the hedging implications amplify.
Example scenario:
If 10,000 call contracts suddenly trade at the $695 strike (which already has heavy gamma), this amplifies the gamma concentration at that level. Market makers must adjust hedging, potentially creating stronger price magnetism toward $695.
Gamma Exposure and Volatility Suppression
One of gamma exposure’s most important effects is its role in either suppressing or amplifying market volatility.
How Positive Gamma Creates Price Stability
The current SPY setup with $2.6B positive gamma creates mechanical stabilizers.
The positive gamma feedback loop:
- Price rises → Market makers are short calls
- Delta increases on their short calls
- They must buy stock to hedge delta
- Their buying supports price… but wait
- As price rises more, they sell to rebalance
- This selling caps upside momentum
Opposite direction:
- Price falls → Market makers’ short calls lose delta
- They have too much stock (over-hedged)
- They must sell stock to reduce hedge
- Their selling accelerates decline… but wait
- As price falls more, they buy to rebalance
- This buying provides support
As price rises, market makers sell stock. As price falls, they buy stock.
This consistent counter-trending pressure narrows trading ranges.
Long-term market effects:
During bull markets with extensive call buying from retail traders, positive gamma can persist for extended periods.
This explains the “grinding higher” price action that frustrates short sellers—market maker hedging consistently provides buying support on any dips.
When Gamma Positioning Fails to Prevent Crashes
Positive gamma’s stabilizing effect has limits.
When unexpected news or systematic shocks hit, even massive positive gamma can’t prevent rapid moves.
How gamma flips during crises:
- Institutional traders close long calls
- Protective put buying accelerates
- Gamma flips from positive to negative rapidly
- Market maker hedging amplifies downside
- Cascading effect creates “air pockets”
Historical examples:
- February 2018: VIX spike caused rapid gamma flip
- March 2020: COVID crash overwhelmed positioning
- Both cases: Protective hedging > existing call positioning
The February 2018 and March 2020 crashes both involved rapid gamma flips as protective hedging overwhelmed existing positioning.
Understanding this limitation prevents overconfidence in gamma-based support levels.
The Role of Options Expiration in Gamma Dynamics
Options expiration dates create gamma decay and position rebalancing.
Expiration effects:
Monthly options expiration (typically the third Friday) sees massive gamma exposure roll off as contracts expire or are closed.
Timeline of expiration week:
- Monday-Wednesday: Traders begin closing positions
- Thursday: Peak adjustment activity
- Friday: Final settlement and gamma decay
- Following Monday: New gamma profile emerges
The days surrounding major expirations often show unusual price action as market makers unwind hedges.
“Pinning” effect explained:
This “pinning” effect pulls price toward strikes with maximum open interest as expiration approaches:
- Market makers with short options at max pain strike
- Need to hedge less as expiration nears
- Reduce buying/selling pressure elsewhere
- Price gravitates toward max pain level
- Effect strongest in final hours before expiration
Advanced Gamma Exposure Concepts
For sophisticated traders, deeper gamma exposure analysis reveals additional trading edges.
Spot Gamma vs Strike Gamma
Spot gamma measures total gamma exposure at the current stock price, while strike-specific gamma shows concentration at individual price levels. The SPY chart displays strike-specific gamma, revealing the exact strikes creating hedging pressure.
Monitoring how spot gamma changes as price moves between strikes provides early warning of regime changes. If SPY rises from $694 to $695, the spot gamma landscape shifts as the massive call wall becomes at-the-money.
Charm and Gamma Decay
Charm, also called delta decay, measures how gamma changes over time. As options approach expiration, at-the-money options see gamma spike while out-of-the-money options see gamma decay to zero.
This temporal dimension of gamma creates predictable patterns around expiration. The clustering of SPY gamma at specific strikes becomes even more influential as expiration approaches.
Vanna and Volga: Second-Order Gamma Effects
Vanna measures how delta changes with implied volatility shifts, while volga measures how vega changes with volatility. These second-order Greeks interact with gamma in complex ways.
During volatility spikes, vanna can amplify gamma effects as both delta and gamma shift simultaneously. Professional options traders monitor these interactions for sophisticated hedging strategies.
Practical Examples: Reading the SPY Gamma Profile
Let’s analyze the specific SPY gamma exposure chart in detail to extract actionable trading insights.
Current Market Conditions
Here’s what the data tells us about current market positioning:
Price action:
- Current price: $694.00
- Previous close: $690.36
- Intraday move: +$3.64 (+0.53%)
Expected movement:
- 1-day expected move: ±$4.11 (0.59%)
- Potential range: $689.89 to $698.11
- Probability: 68% (one standard deviation)
- Outside this range: Occurs ~32% of the time
Gamma positioning:
- Net gamma: +$2.6B (strongly positive)
- Indicates: Price stability and range-bound conditions
- Implications: Violent moves less likely without major catalysts
Net gamma sits firmly positive at $2.6B, indicating market makers are net short options.
This creates the price stability and range-bound conditions mentioned earlier. With such heavy positive gamma, violent moves in either direction become less likely without major catalysts.
Strike-by-Strike Trade Planning
Each key strike level provides specific trading intelligence:
$700 Strike – Upper Resistance:
- Net gamma: 1.6B
- Total open interest: 261,370 contracts
- Trading implication: Strong resistance zone
- Strategy: Profit-taking level for longs, entry for shorts with tight stops
$695 Strike – The Call Wall (Maximum Concentration):
- Net gamma: 2.3B (heaviest gamma in the entire chain)
- Total open interest: 189,777 contracts
- Trading implication: Price gravitates toward this level
- Strategy: Ideal for premium selling (iron condors, credit spreads)
- Reasoning: Highest probability outcome given hedging dynamics
$694 Strike – Current Spot Price:
- Current trading level
- Net gamma: 509M (moderate)
- Position: Just below the call wall
- Momentum: Pulling toward $695
$690 Strike – Critical Downside Support:
- Net gamma: -953.3M (negative!)
- Total open interest: 306,246 contracts
- Trading implication: First major negative gamma level
- Stop loss level: Ideal for long positions
- Risk if broken: Accelerated selling from market maker hedging
The $700 strike represents the upper boundary of likely near-term movement. With 1.6B in net gamma and 261,370 total open interest, this strike creates significant resistance.
Traders might consider this a profit-taking level for long positions or an entry point for short positions with tight stops.
The $695 call wall shows the heaviest concentration at 2.3B net gamma. Price gravitating toward this level makes sense from a hedging perspective.
Options strategies centered on this strike (selling premium around $695) align with the highest probability outcomes.
Downside, the $690 strike at -953.3M net gamma represents the first significant negative gamma level.
A break below here could trigger accelerated selling as market makers flip from buying dips to selling into weakness. This makes $690 an ideal stop-loss level for bullish positions.
Volume and Open Interest Analysis
The relationship between calls and puts reveals institutional sentiment:
Call side positioning:
- Total call open interest: 5,050,376 contracts
- Call gamma: $23.8B
- Interpretation: Heavy bullish positioning or covered call writing
Put side positioning:
- Total put open interest: 11,746,358 contracts (more than 2x calls!)
- Put gamma: -$21.2B
- Interpretation: Substantial protective put buying
Key insight: While put open interest dramatically exceeds calls, the gamma values nearly balance.
This indicates substantial institutional put buying for portfolio protection rather than outright bearish speculation. The hedging activity from these protective puts contributes to the overall positive gamma environment.
Intraday Trading Opportunities
For day traders, the gamma exposure profile creates clear boundaries:
Ideal trading range:
- Lower bound: $690 (negative gamma begins)
- Upper bound: $698 (approaching $700 resistance)
- Sweet spot: Operating within this range aligns with hedging flows
Breakout considerations:
- Trades beyond these levels fight market maker hedging
- Require: Significant volume and conviction
- Risk: Mechanical flows work against breakouts
Optimal strategies for current environment:
Range-trading strategies excel in high positive gamma environments:
- Iron condors: Sell OTM call/put spreads, capture theta decay
- Credit spreads: Centered on $695 strike for maximum gamma protection
- Benefit: Gamma suppression limits risk from adverse moves
- Risk management: Still use defined-risk spreads despite favorable environment
Gamma Exposure Trading Strategies
Translating gamma exposure analysis into concrete trading approaches requires understanding which strategies profit from each gamma regime.
Trading Positive Gamma Environments
With SPY displaying strong positive gamma, several strategies become attractive:
Iron Condors (Defined Risk):
- Structure: Sell OTM call spread + OTM put spread simultaneously
- SPY example: Sell $700 call spread, sell $690 put spread
- Profit from: Range-bound price action between strikes
- Maximum profit: Total premium collected
- Risk: Defined by spread width
- Ideal for: Current high positive gamma environment
Short Straddles/Strangles (Undefined Risk):
- Structure: Sell ATM call and put simultaneously (straddle) or OTM versions (strangle)
- SPY example: Sell $695 call and $695 put for maximum premium
- Profit from: Price staying near $695, theta decay
- Maximum profit: Premium collected
- Risk: Unlimited (requires margin and experience)
- Benefit: Positive gamma limits expansion risk
- Best for: Traders comfortable with undefined risk
Calendar Spreads (Time Decay Differential):
- Structure: Sell front-month option, buy back-month option (same strike)
- SPY example: Sell weekly $695 call, buy monthly $695 call
- Profit from: Faster decay in near-term options
- Reasoning: High positive gamma in near-term expirations = faster decay
- Maximum profit: When stock at strike at front-month expiration
- Risk: Limited to net debit paid
Preparing for Negative Gamma Transitions
Smart traders prepare for eventual gamma flips by monitoring several indicators:
Warning signs of potential gamma flip:
- Rapid increases in put volume at strikes below current support
- Declining net gamma despite stable prices
- Unusual institutional options activity (large block trades)
- Shift in put/call ratio toward extreme readings
- Increasing implied volatility despite range-bound prices
Defensive adjustments when gamma approaches neutral:
- Tighten stop-losses on existing positions
- Reduce position sizes across portfolio
- Add protective put options as insurance
- Scale out of premium-selling strategies
- Prepare capital for directional opportunities
When gamma approaches neutral, defensive adjustments make sense.
Tightening stop-losses, reducing position sizes, and adding protective options create cushions against volatility expansion.
Event-Driven Gamma Exposure Plays
Major catalysts temporarily overwhelm existing gamma positioning.
High-impact events that change gamma dynamics:
- FOMC announcements (Federal Reserve policy decisions)
- Monthly employment reports (NFP data)
- CPI data releases (inflation reports)
- Earnings season for major index components
- Geopolitical shocks or unexpected news
FOMC announcements, employment reports, and CPI data create binary outcomes that render pre-event gamma analysis less relevant.
Strategies around major events:
Around these events, strategies shift from gamma-based to volatility-based:
- Before events: Buy straddles/strangles 1-2 days early
- Profit source: Gamma expansion as market makers widen ranges
- Exit timing: Shortly after event (avoid volatility crush)
- Risk: Overpaying if implied volatility already elevated
Long straddles and strangles purchased ahead of events profit from gamma expansion as market makers adjust hedging algorithms for wider expected moves.
Frequently Asked Questions About Gamma Exposure
What does positive gamma exposure mean for stock prices?
Positive gamma exposure creates price stability and range-bound trading conditions. When net gamma is positive, market makers must buy stock as prices fall and sell stock as prices rise, providing natural support and resistance. This dampens volatility and creates choppy, mean-reverting price action. The current SPY environment with $2.6B positive gamma exemplifies this stabilizing effect.
How do market makers hedge gamma exposure?
Market makers hedge gamma exposure by adjusting their stock holdings as prices move. When short call options (positive gamma for market makers), they buy stock as prices rise and sell as prices fall to maintain delta-neutral positioning. With the massive SPY call gamma of $23.8B, market makers must execute enormous hedging flows throughout each trading session, creating the mechanical price pressure that influences stock movement.
What is a gamma squeeze in options trading?
A gamma squeeze occurs when rapid price movement in one direction forces market makers to accelerate their hedging activity, amplifying the move further. If SPY rallied quickly toward $700, market makers short those calls would need to buy increasing amounts of stock to hedge their growing delta exposure. This buying creates upward pressure, pushing prices even higher, requiring more hedging—a self-reinforcing feedback loop.
How does gamma exposure affect implied volatility?
High positive gamma environments typically coincide with lower implied volatility because mechanical hedging activity suppresses realized volatility. Options markets anticipate range-bound conditions, reducing premium values. Conversely, negative gamma environments see implied volatility expansion as traders demand higher premium for the increased risk of explosive moves. The SPY 1-day expected move of 0.59% reflects compressed volatility from positive gamma.
Where can I find real-time gamma exposure data?
Real-time gamma exposure data requires premium platforms like Cheddarflow (shown in the image), SpotGamma, SqueezeMetrics, or Tradytics. These services calculate aggregate positioning across all strikes and expirations, providing institutional-grade analysis. Free alternatives include basic options chain data from brokers and CBOE aggregate metrics, though these lack the precision and visualization of paid services.
Is negative gamma exposure bullish or bearish?
Negative gamma exposure is neither inherently bullish nor bearish—it’s volatility-positive. Negative gamma amplifies moves in both directions as market makers must sell into declines and buy into rallies, reinforcing existing momentum. The $690 strike showing -953.3M gamma represents a level where downside acceleration could occur if breached, but upward moves from negative gamma positioning can be equally explosive.
How does gamma exposure change around earnings?
Earnings announcements dramatically increase implied volatility and alter gamma profiles. Traders buy both calls and puts ahead of earnings, creating higher gamma concentrations at strikes near current price. Post-earnings, as implied volatility collapses, gamma exposure rapidly decays. This volatility crush benefits premium sellers but can create losses for options buyers regardless of directional accuracy.
What is the difference between GEX and open interest?
Open interest counts total option contracts outstanding, while gamma exposure (GEX) measures the hedging pressure those positions create. A strike can have enormous open interest but minimal gamma if the options are far out-of-the-money or long-dated. The SPY chart shows total open interest of 16.8M contracts, but gamma concentrates at specific near-the-money strikes where hedging impact is greatest.
Can gamma exposure predict market crashes?
Gamma exposure analysis can identify conditions favorable to crashes but cannot predict them with certainty. Extreme negative gamma environments create vulnerability to cascading selloffs, as seen in past crashes. However, positive gamma can flip negative rapidly during crisis conditions. The SPY’s current positive gamma suggests stability, but unexpected systematic shocks can overwhelm any technical positioning.
How long does high gamma exposure last?
Gamma exposure duration depends on options expiration cycles and trader positioning. Weekly options create short-lived gamma concentrations that dissipate at Friday expiration, while monthly options create longer-lasting dynamics. The SPY profile shown includes multiple expiration dates, with near-term expirations wielding disproportionate influence. Monitoring gamma changes throughout expiration cycles reveals evolving market dynamics.
Should beginners trade based on gamma exposure?
Beginning options traders should understand gamma exposure conceptually before incorporating it into trading decisions. The mechanical hedging flows created by gamma positioning influence all market participants, making basic awareness valuable. However, execution of gamma-based strategies requires options experience, risk management discipline, and access to real-time data. Start by monitoring gamma levels to understand market structure before implementing gamma-focused trades.
What happens to gamma exposure at market open and close?
Gamma exposure’s impact intensifies during the opening and closing hours when liquidity is highest and market makers execute their largest hedging flows. The first and last 30 minutes of trading often see accelerated movement as institutional hedging activity concentrates. Intraday traders monitoring gamma profiles should expect enhanced volatility at these times as mechanical flows dominate order books.
How do stock buybacks interact with gamma exposure?
Corporate buyback programs can counteract or amplify gamma exposure effects. When companies buy their own stock, they provide consistent demand that can offset market maker selling pressure from positive gamma. Conversely, during buyback blackout periods (earnings windows), the absence of corporate demand allows gamma-driven dynamics to operate with less interference. The timing of buyback activity relative to gamma positioning creates complex interactions.
Can gamma exposure analysis work for individual stocks?
Gamma exposure analysis works best for heavily traded names with liquid options markets. SPY, QQQ, AAPL, TSLA, and NVDA all have sufficient options activity to create meaningful gamma profiles. Smaller stocks with limited options volume lack the mechanical hedging flows that make gamma analysis valuable. For individual stocks, combine gamma awareness with fundamental and technical analysis rather than relying on gamma alone.
Key Takeaways: Gamma Exposure Trading Intelligence
Understanding gamma exposure gives traders a significant edge in modern markets. Here are the essential concepts to remember:
Core concept:
Gamma exposure represents mechanical hedging pressure from market makers that significantly influences stock price movement and volatility.
The current SPY profile demonstrates a classic positive gamma environment with $2.6B net exposure, creating conditions favorable for range-trading strategies.
Positive vs negative gamma:
Understanding whether gamma positioning is positive or negative helps traders anticipate market regime changes:
- Positive gamma: Rewards premium selling and range-trading approaches
- Negative gamma: Favors directional momentum strategies and protective hedging
- Neutral gamma: Transition periods with unpredictable volatility
Critical price levels:
The strike-by-strike gamma profile reveals critical price levels where hedging flows concentrate:
- SPY $695 strike: Call wall with 2.3B gamma (price magnet)
- SPY $690 strike: Negative gamma at -953.3M (critical support)
- SPY $700 strike: Upper resistance with 1.6B gamma
These levels create clear boundaries for trade planning and risk management.
Integration with trading process:
Sophisticated traders incorporate gamma exposure analysis alongside traditional technical and fundamental research.
Gamma provides the “why” behind many unexplained price movements, revealing the invisible hand of market maker hedging that shapes modern market microstructure.
Growing importance:
As options trading volumes continue growing, particularly in zero-day-to-expiration contracts, gamma exposure’s influence on underlying stock prices intensifies.
Statistics showing the trend:
- 0DTE options now account for 40%+ of SPY volume
- Weekly options growing faster than monthly
- Retail options trading up 300%+ since 2019
- Gamma concentration increasing at key strikes
Staying ahead of these dynamics separates informed traders from those puzzled by markets that seem to defy logic.
Action steps for traders:
- Monitor gamma exposure daily for positions
- Identify key gamma levels for support/resistance
- Adjust strategies based on positive/negative gamma
- Prepare for gamma flips during major events
- Use gamma data to time entries and exits
About BullishFlow.com: We provide in-depth research on dividend stocks, earnings analysis, and options trading education. Our mission is empowering investors with institutional-quality research to make informed investment decisions. Subscribe to our newsletter for weekly market insights and dividend stock recommendations.
Investment Disclaimer: This article is for educational purposes only and does not constitute investment advice. Options trading involves substantial risk of loss and is not suitable for all investors. Past performance does not guarantee future results. Consult with a qualified financial advisor before making investment decisions.


